Visualizing result using bar and line graphs with basic statistics
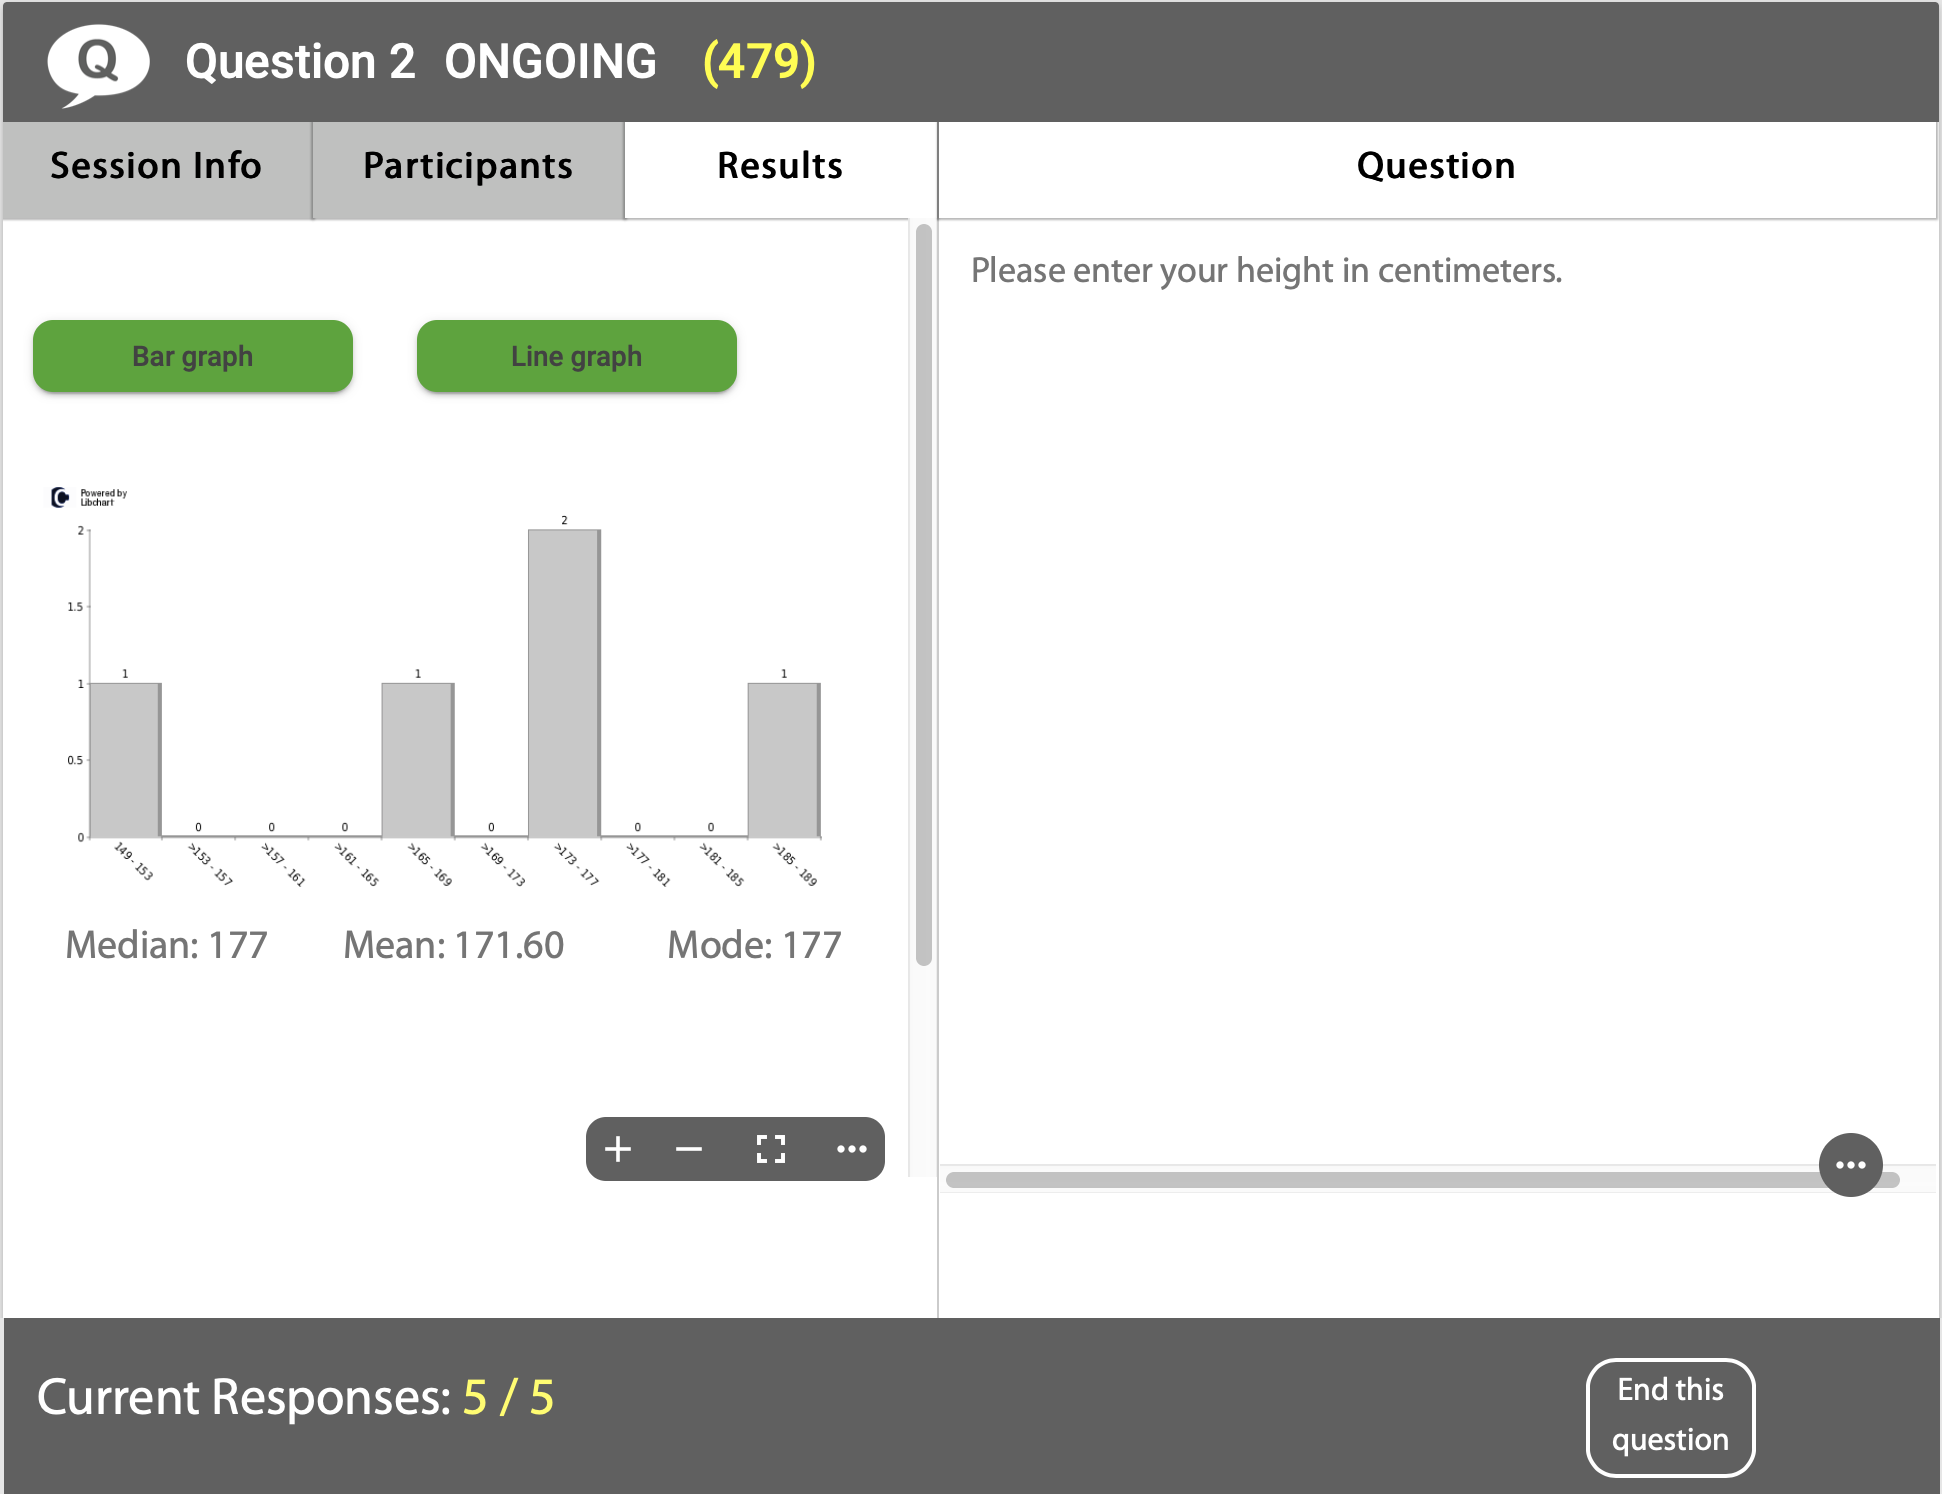
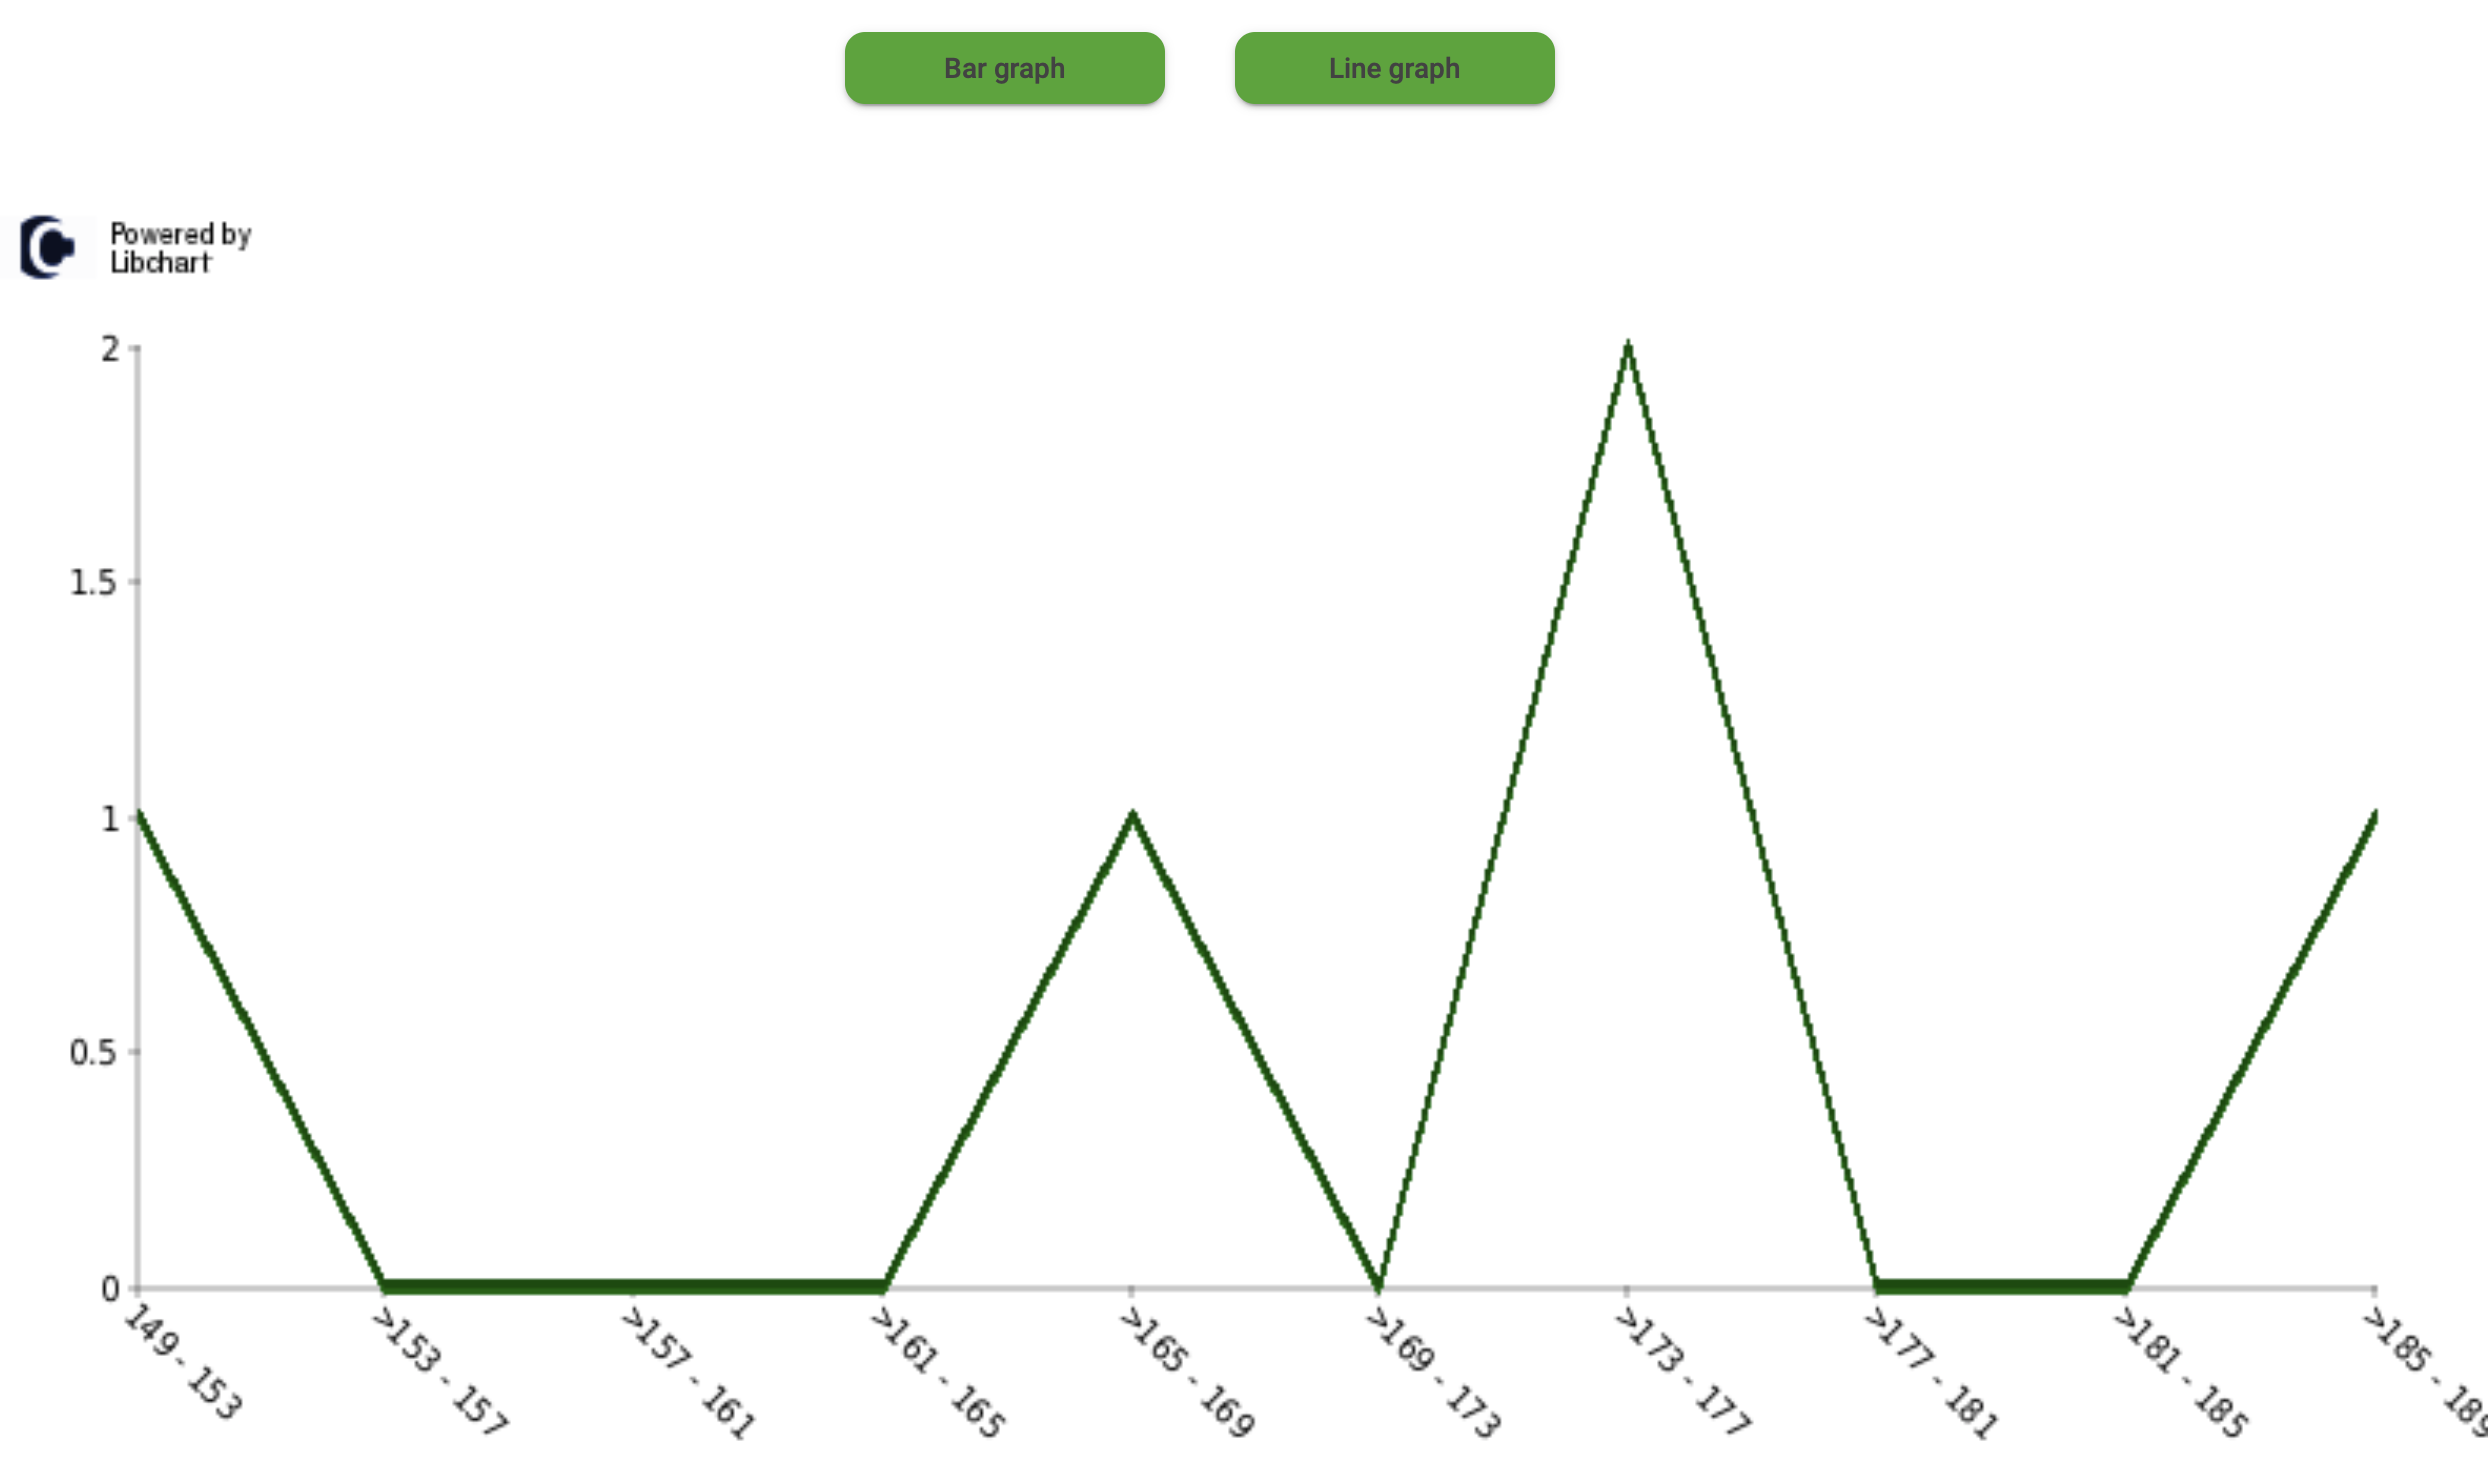
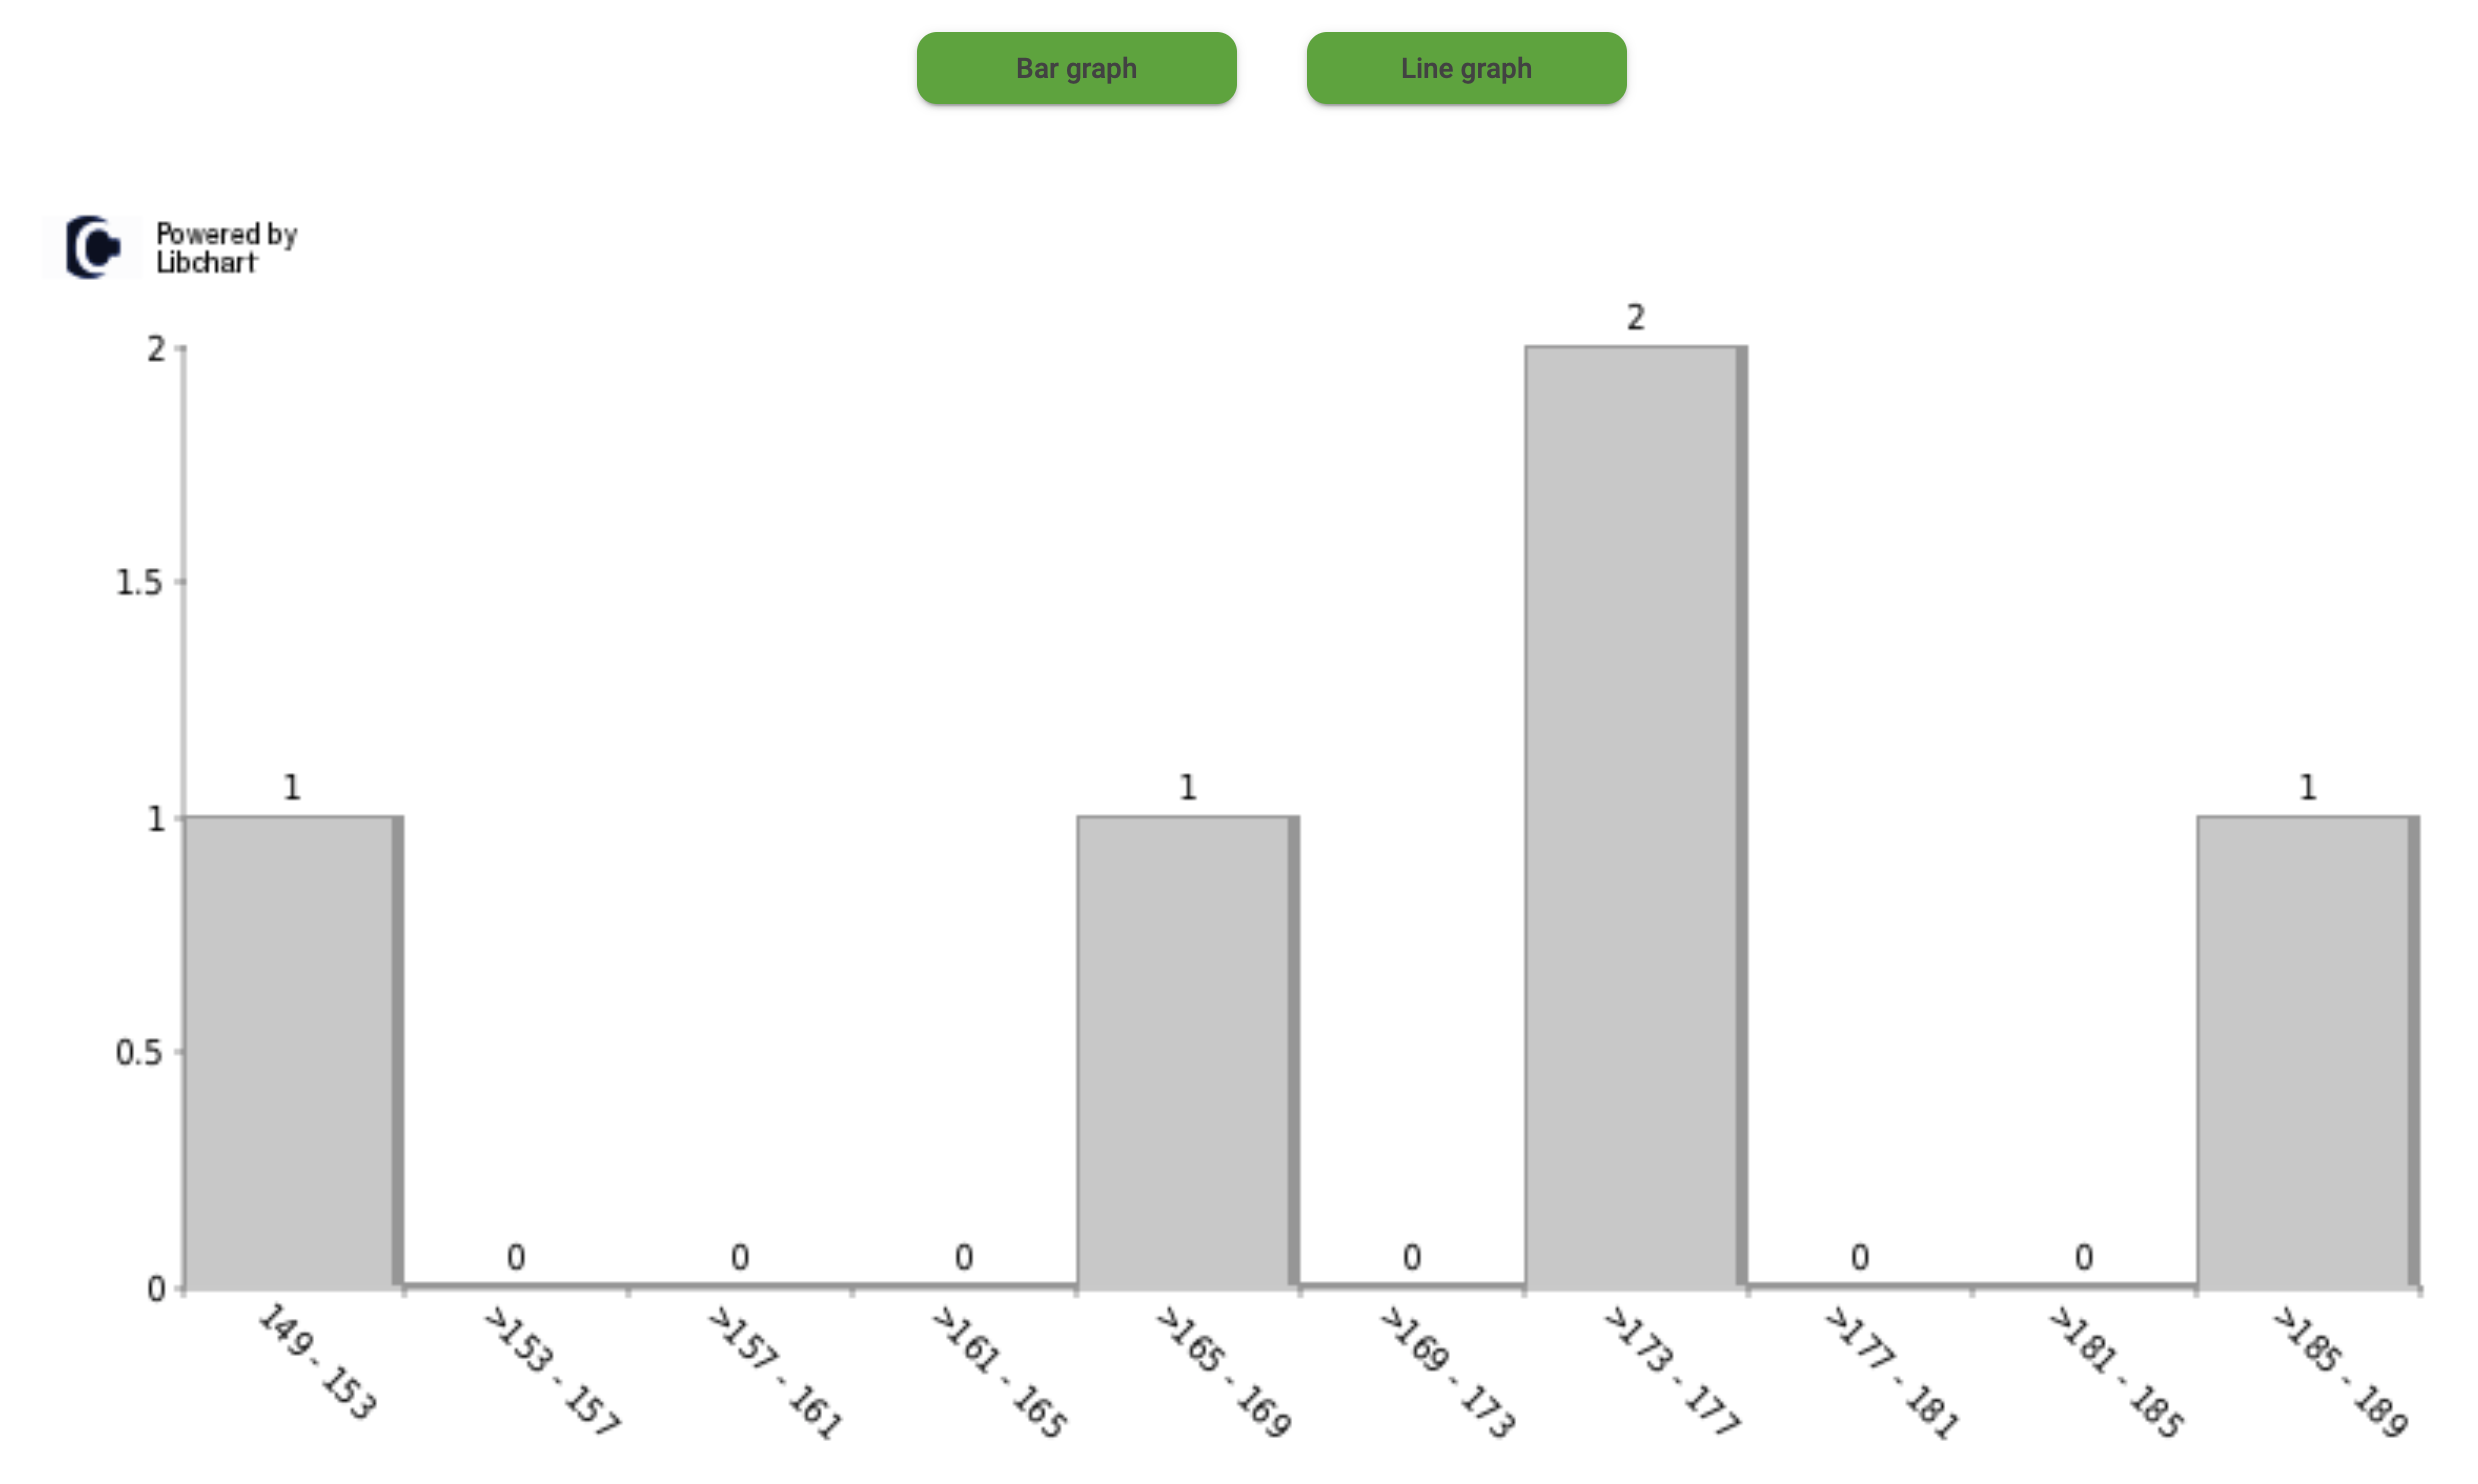
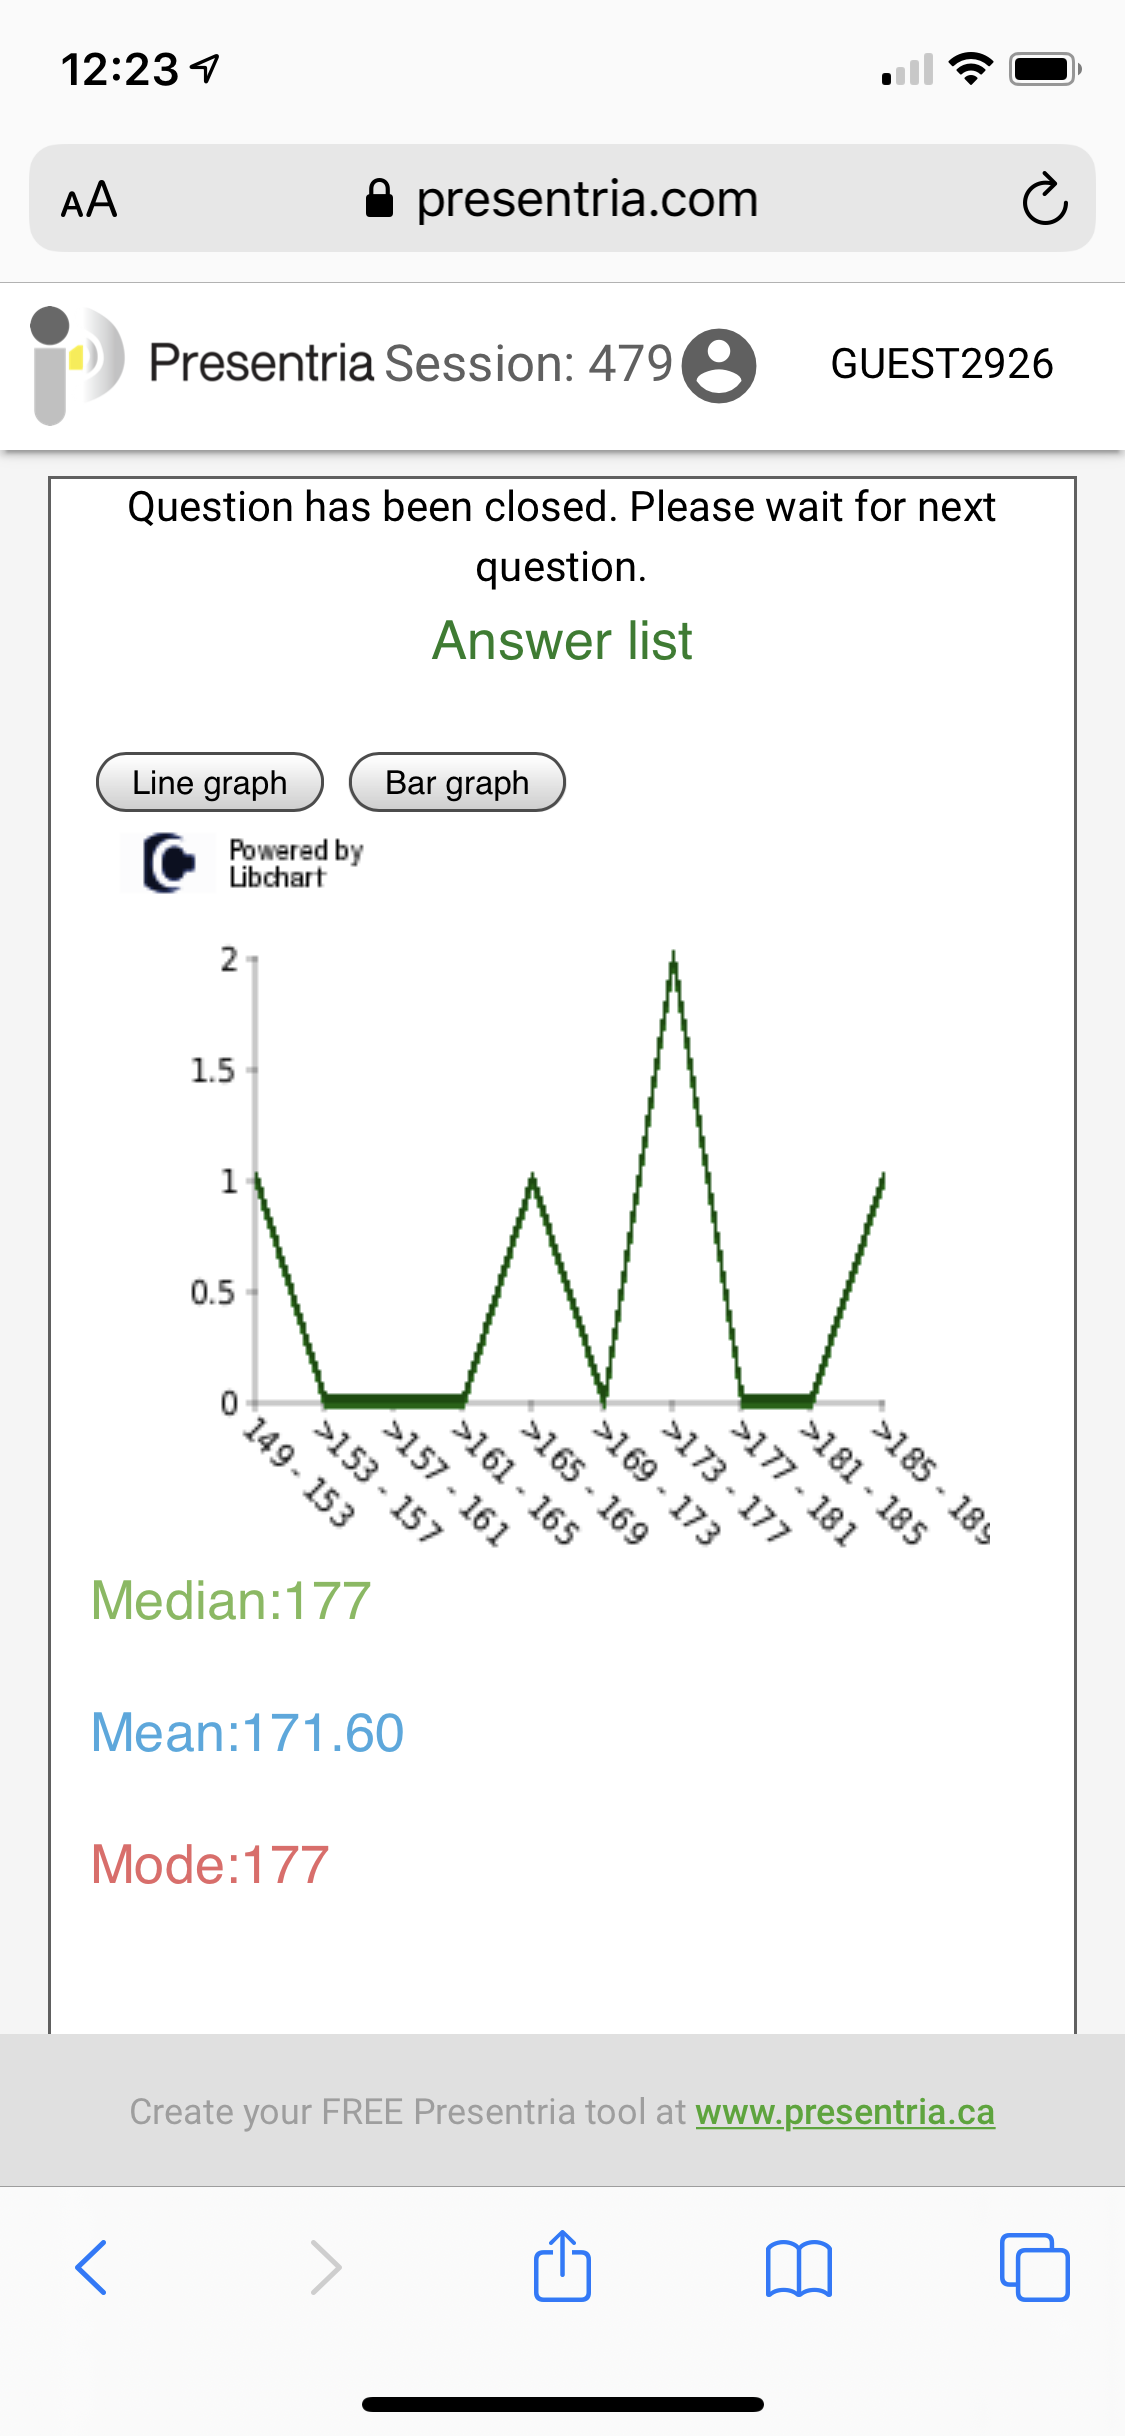
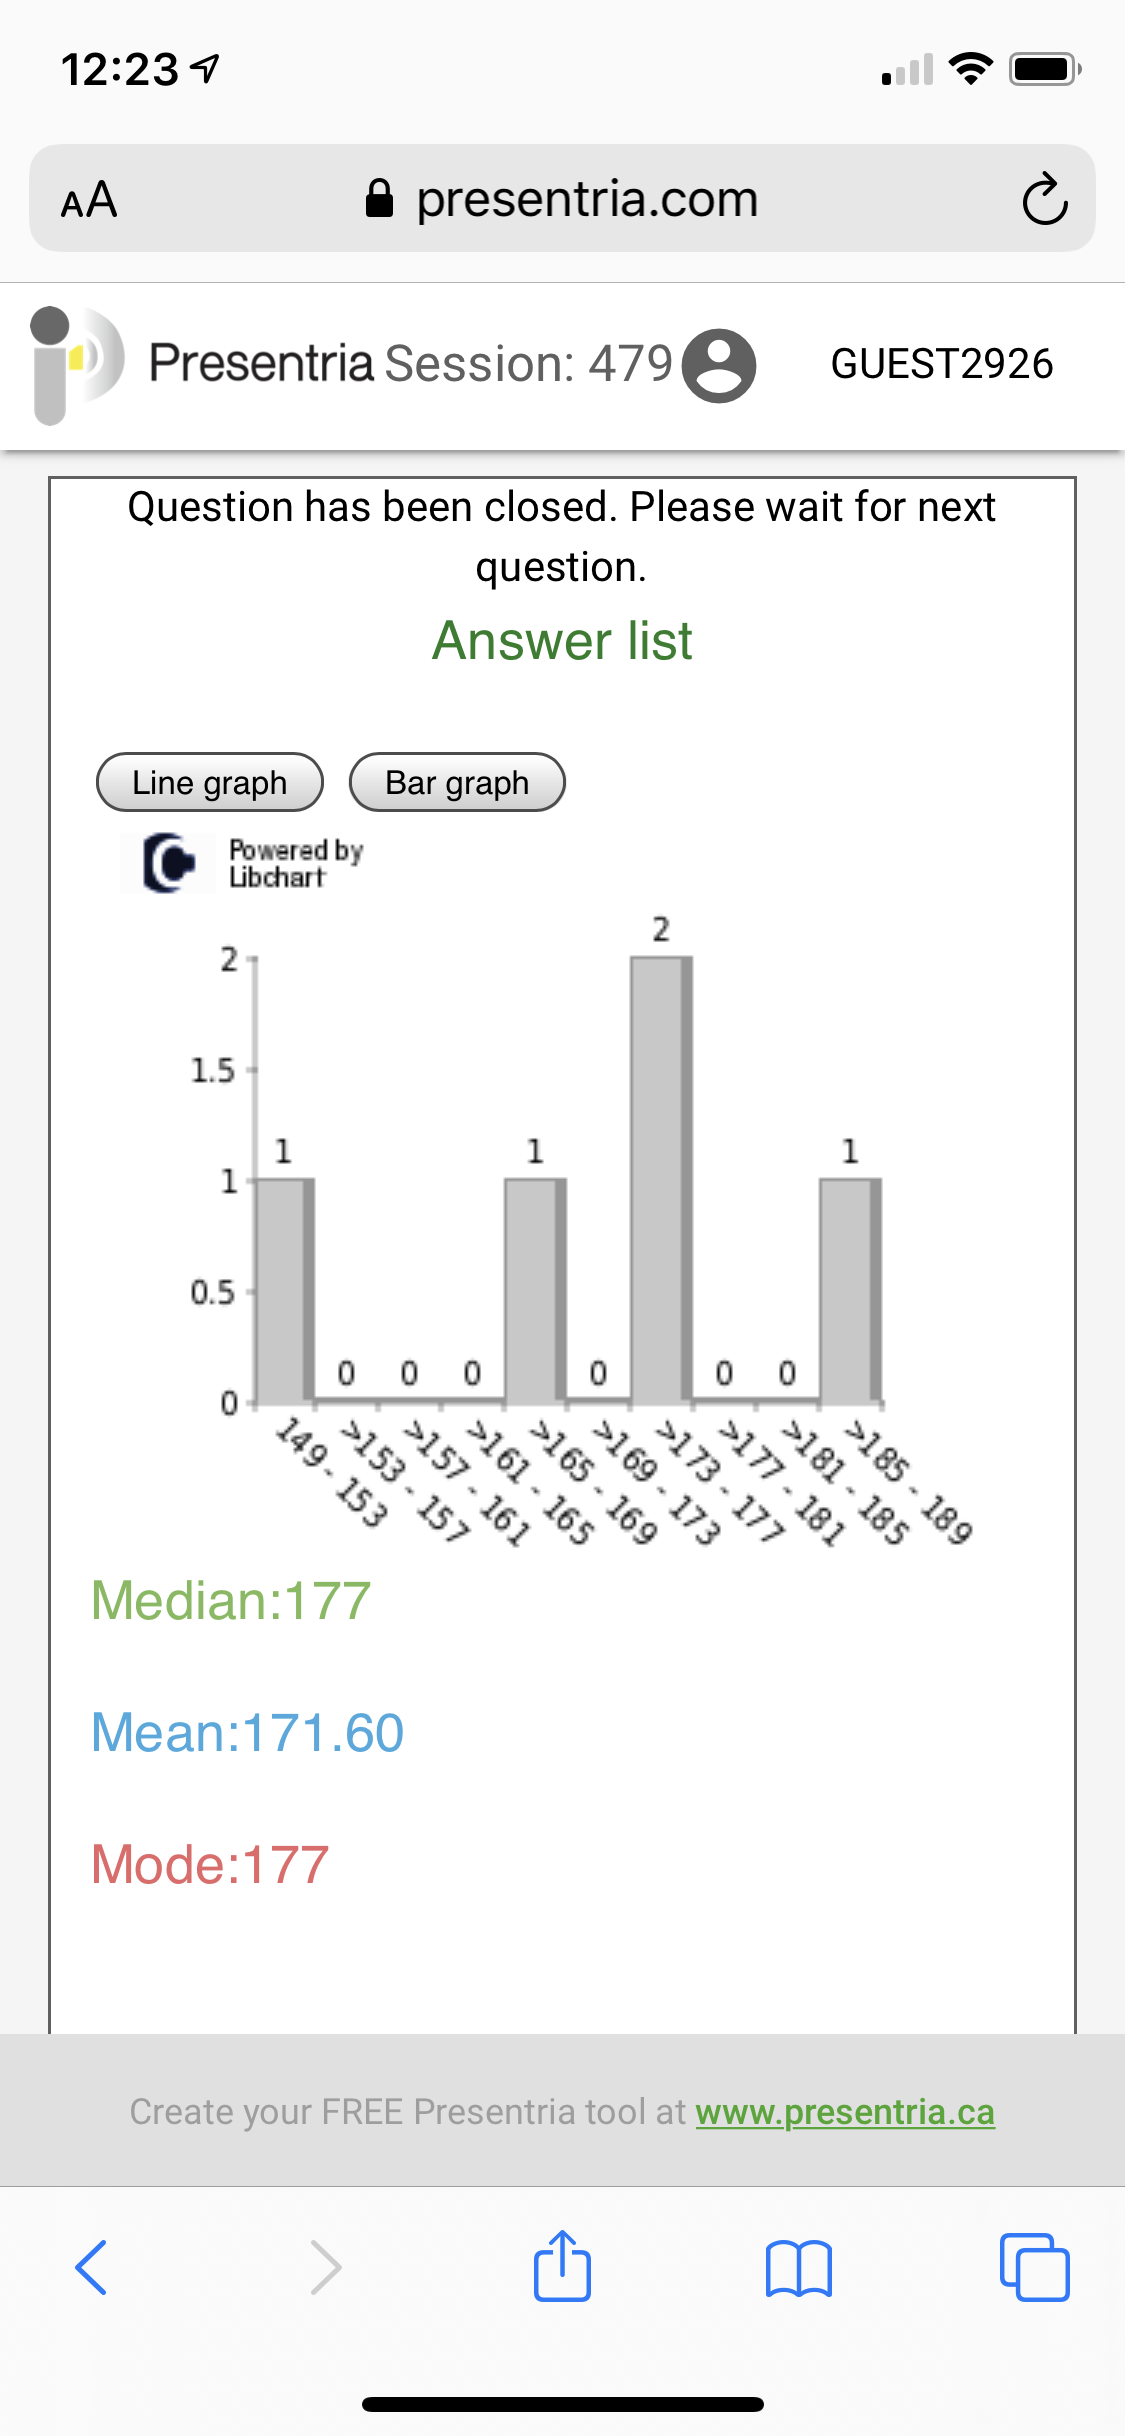
 Feature: If the "Numeric value" question type is used, the instructor can show quiz results using a bar or line graph, with basic statistics (Median, Mean and Mode) that is powered by LibChart.

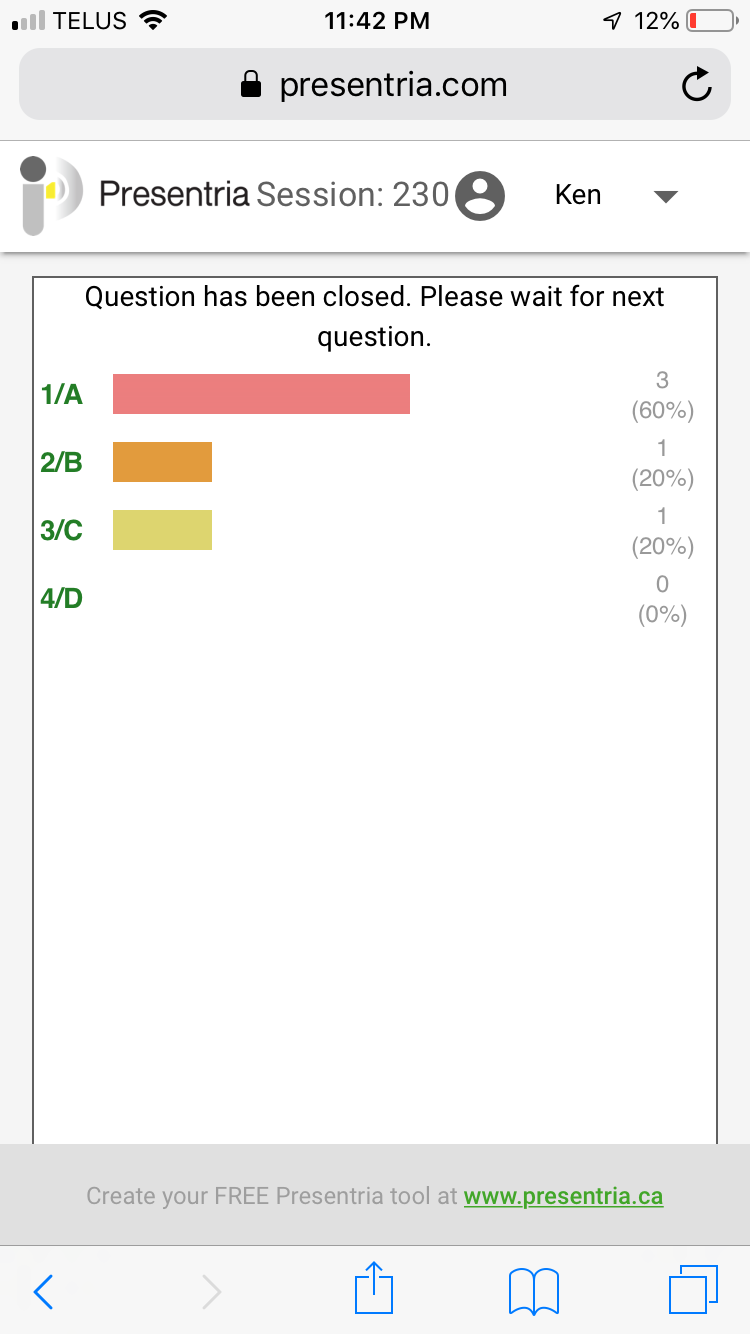
 Feature: Answers will also be summarized and displayed on students' mobile device.

Feature: If the "Multiple choice" question type is used, the instructor can display quiz results in real-time on the big project screen.
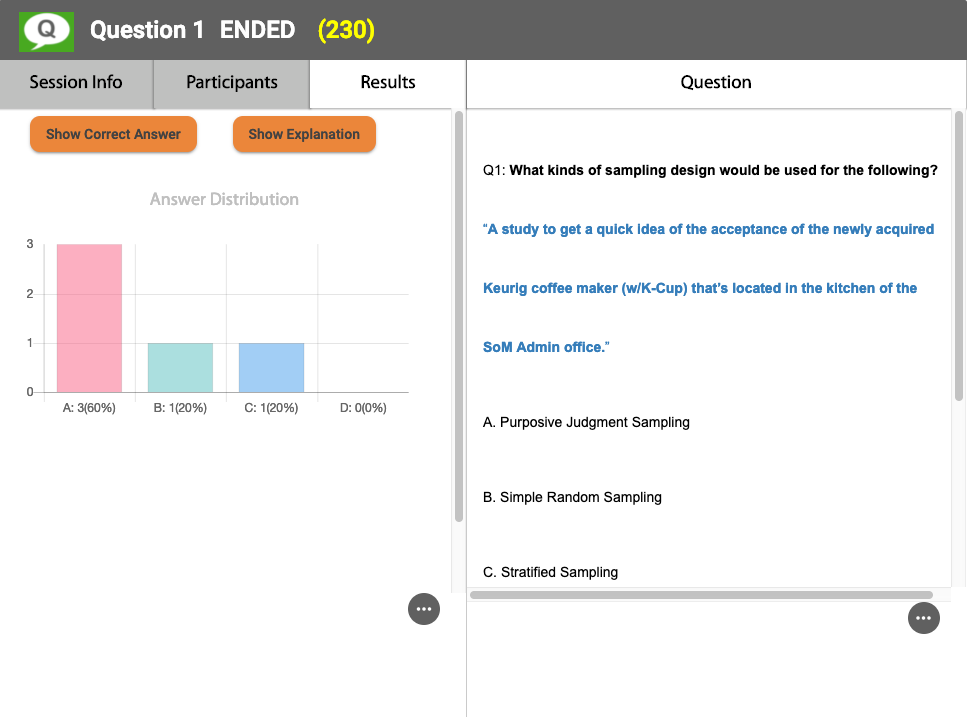
Feature: The results are also displayed on students' mobile devices simultaneously.