Numeric Value
Powerful Features Designed by Educators
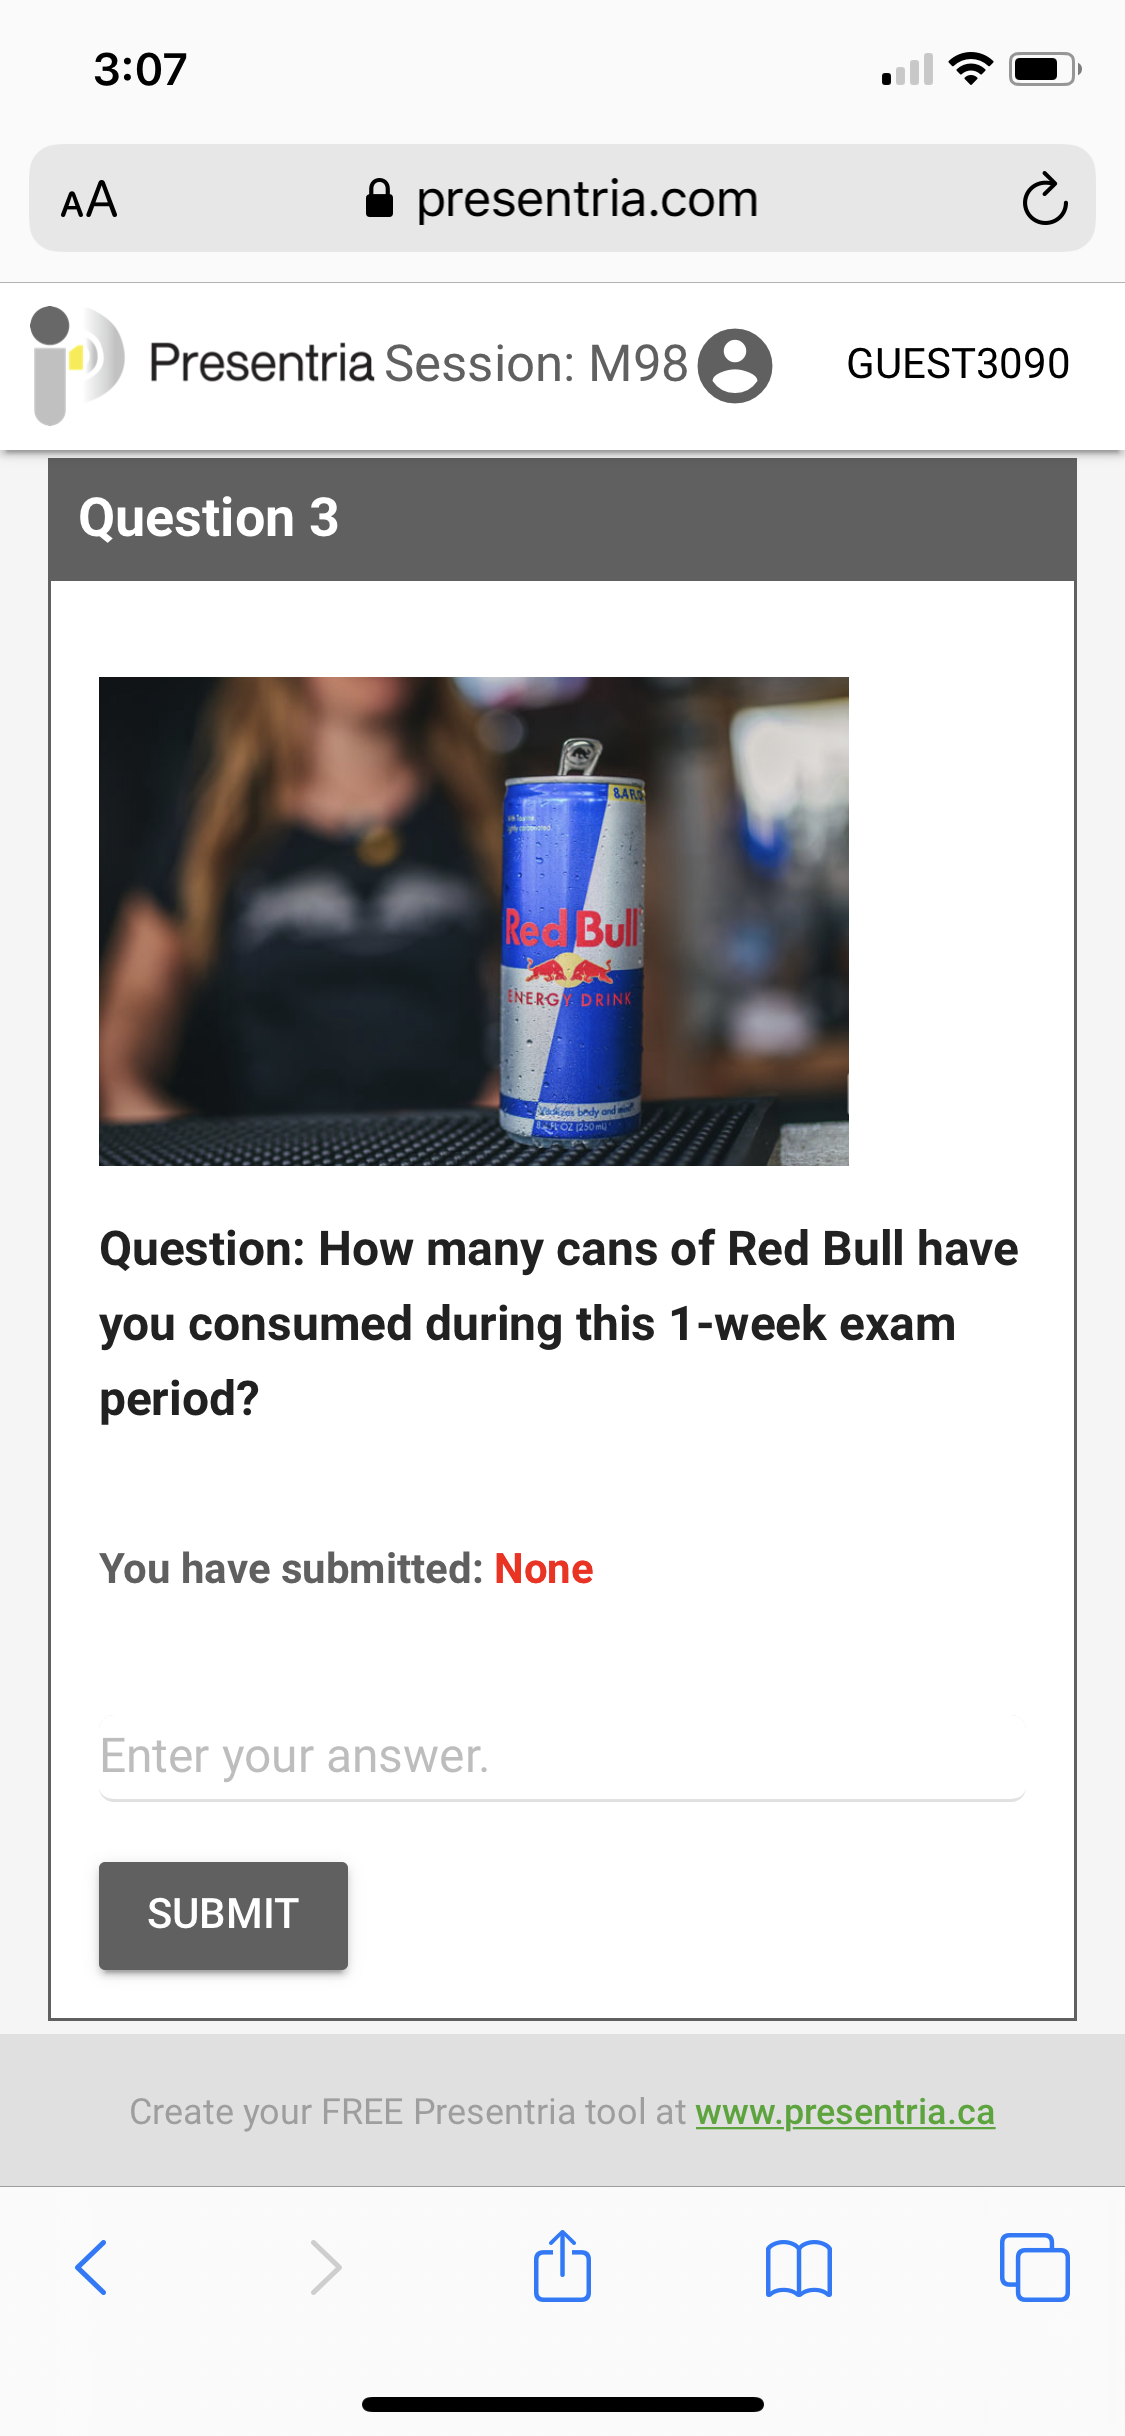
- You can use Presentria to collect data in numeric values.
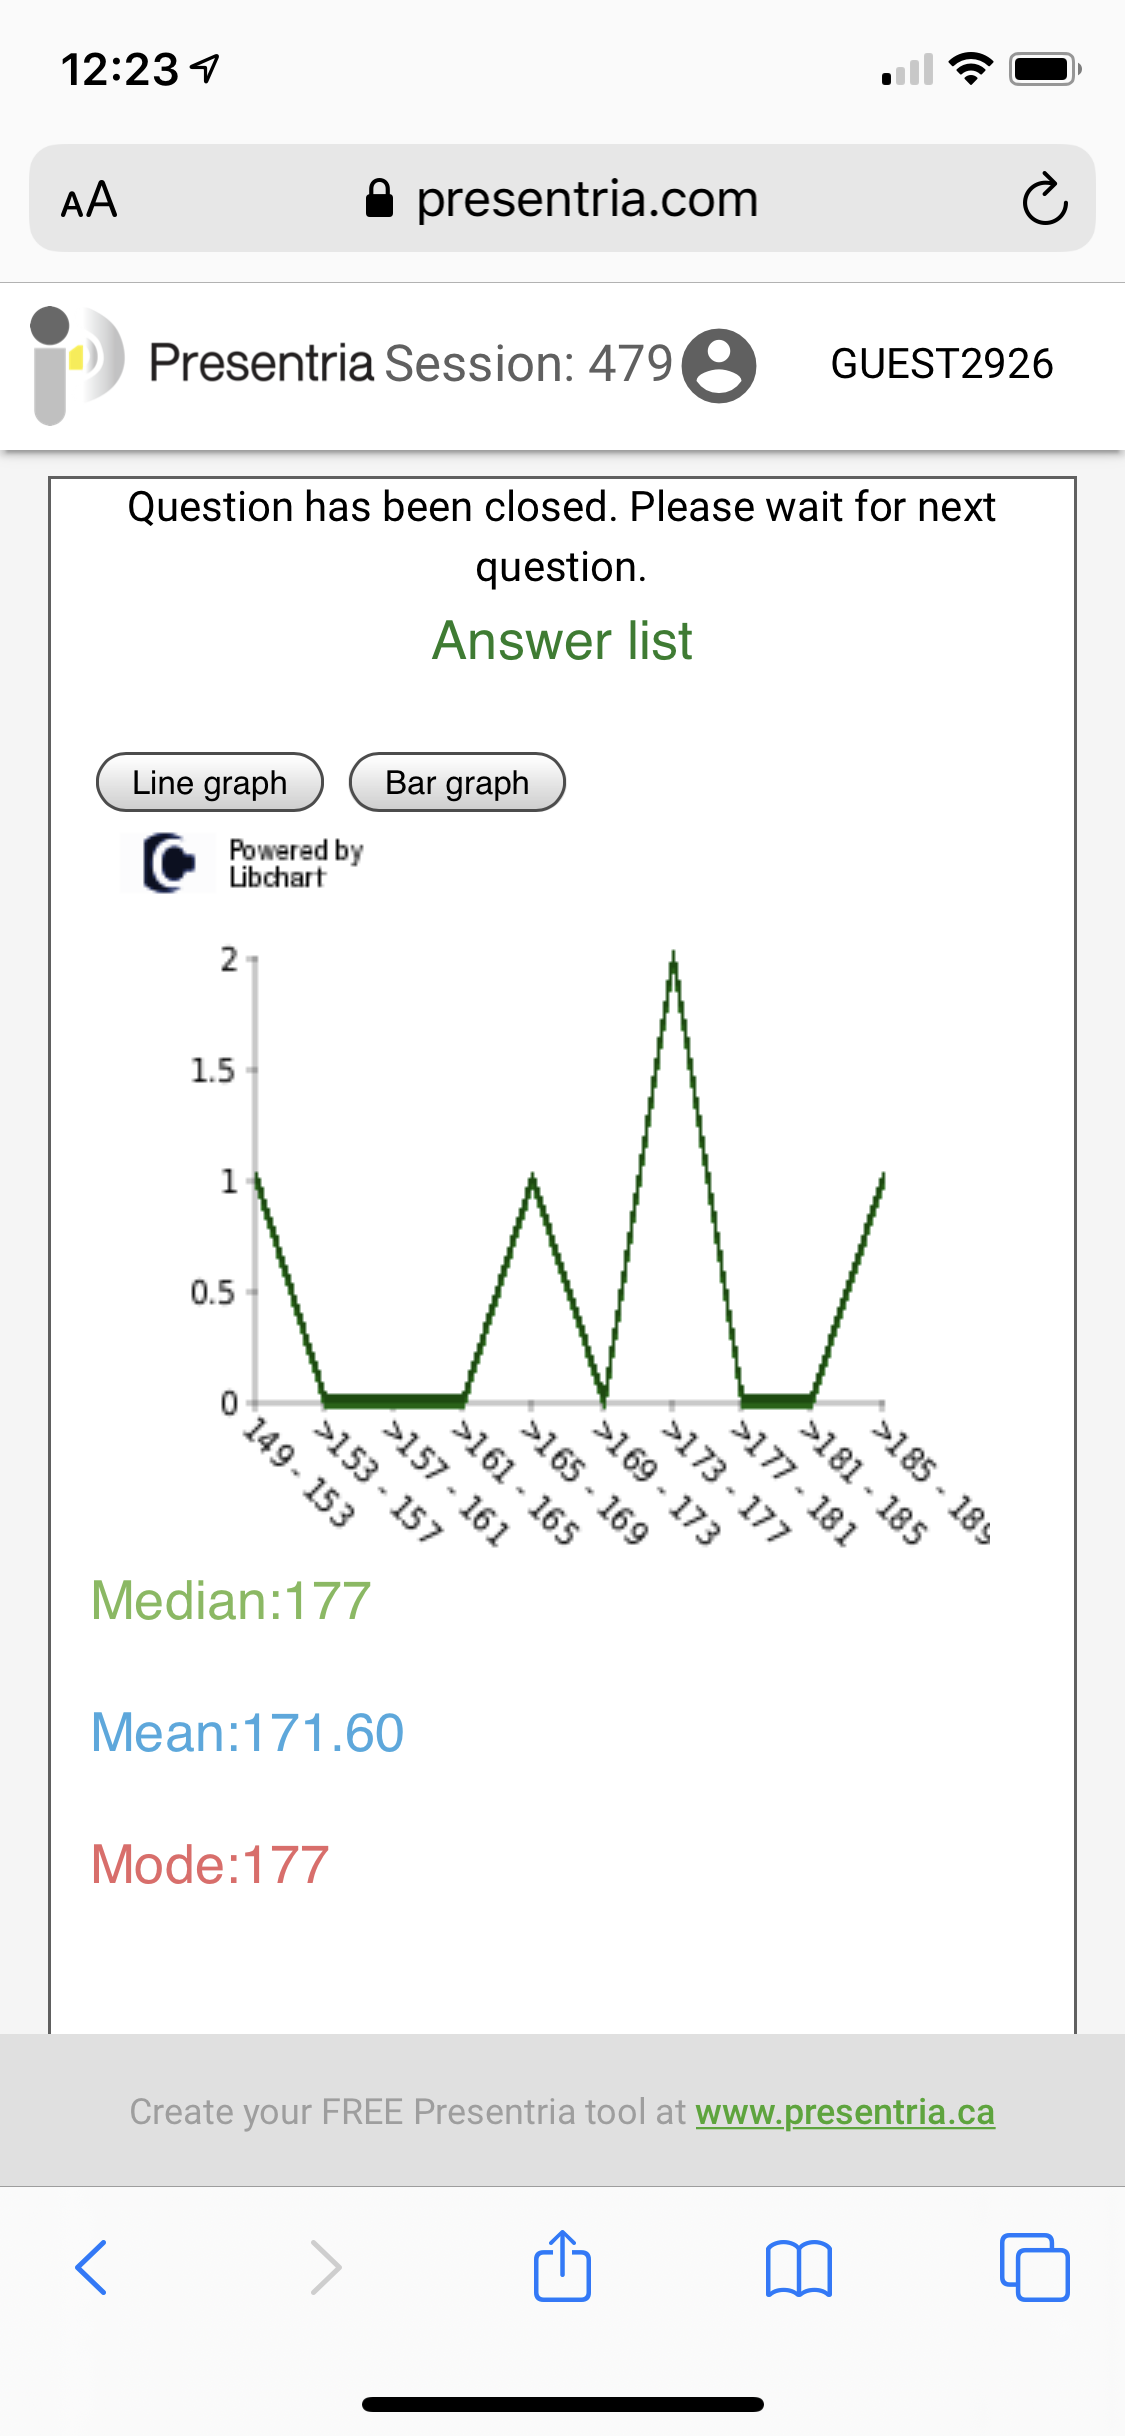
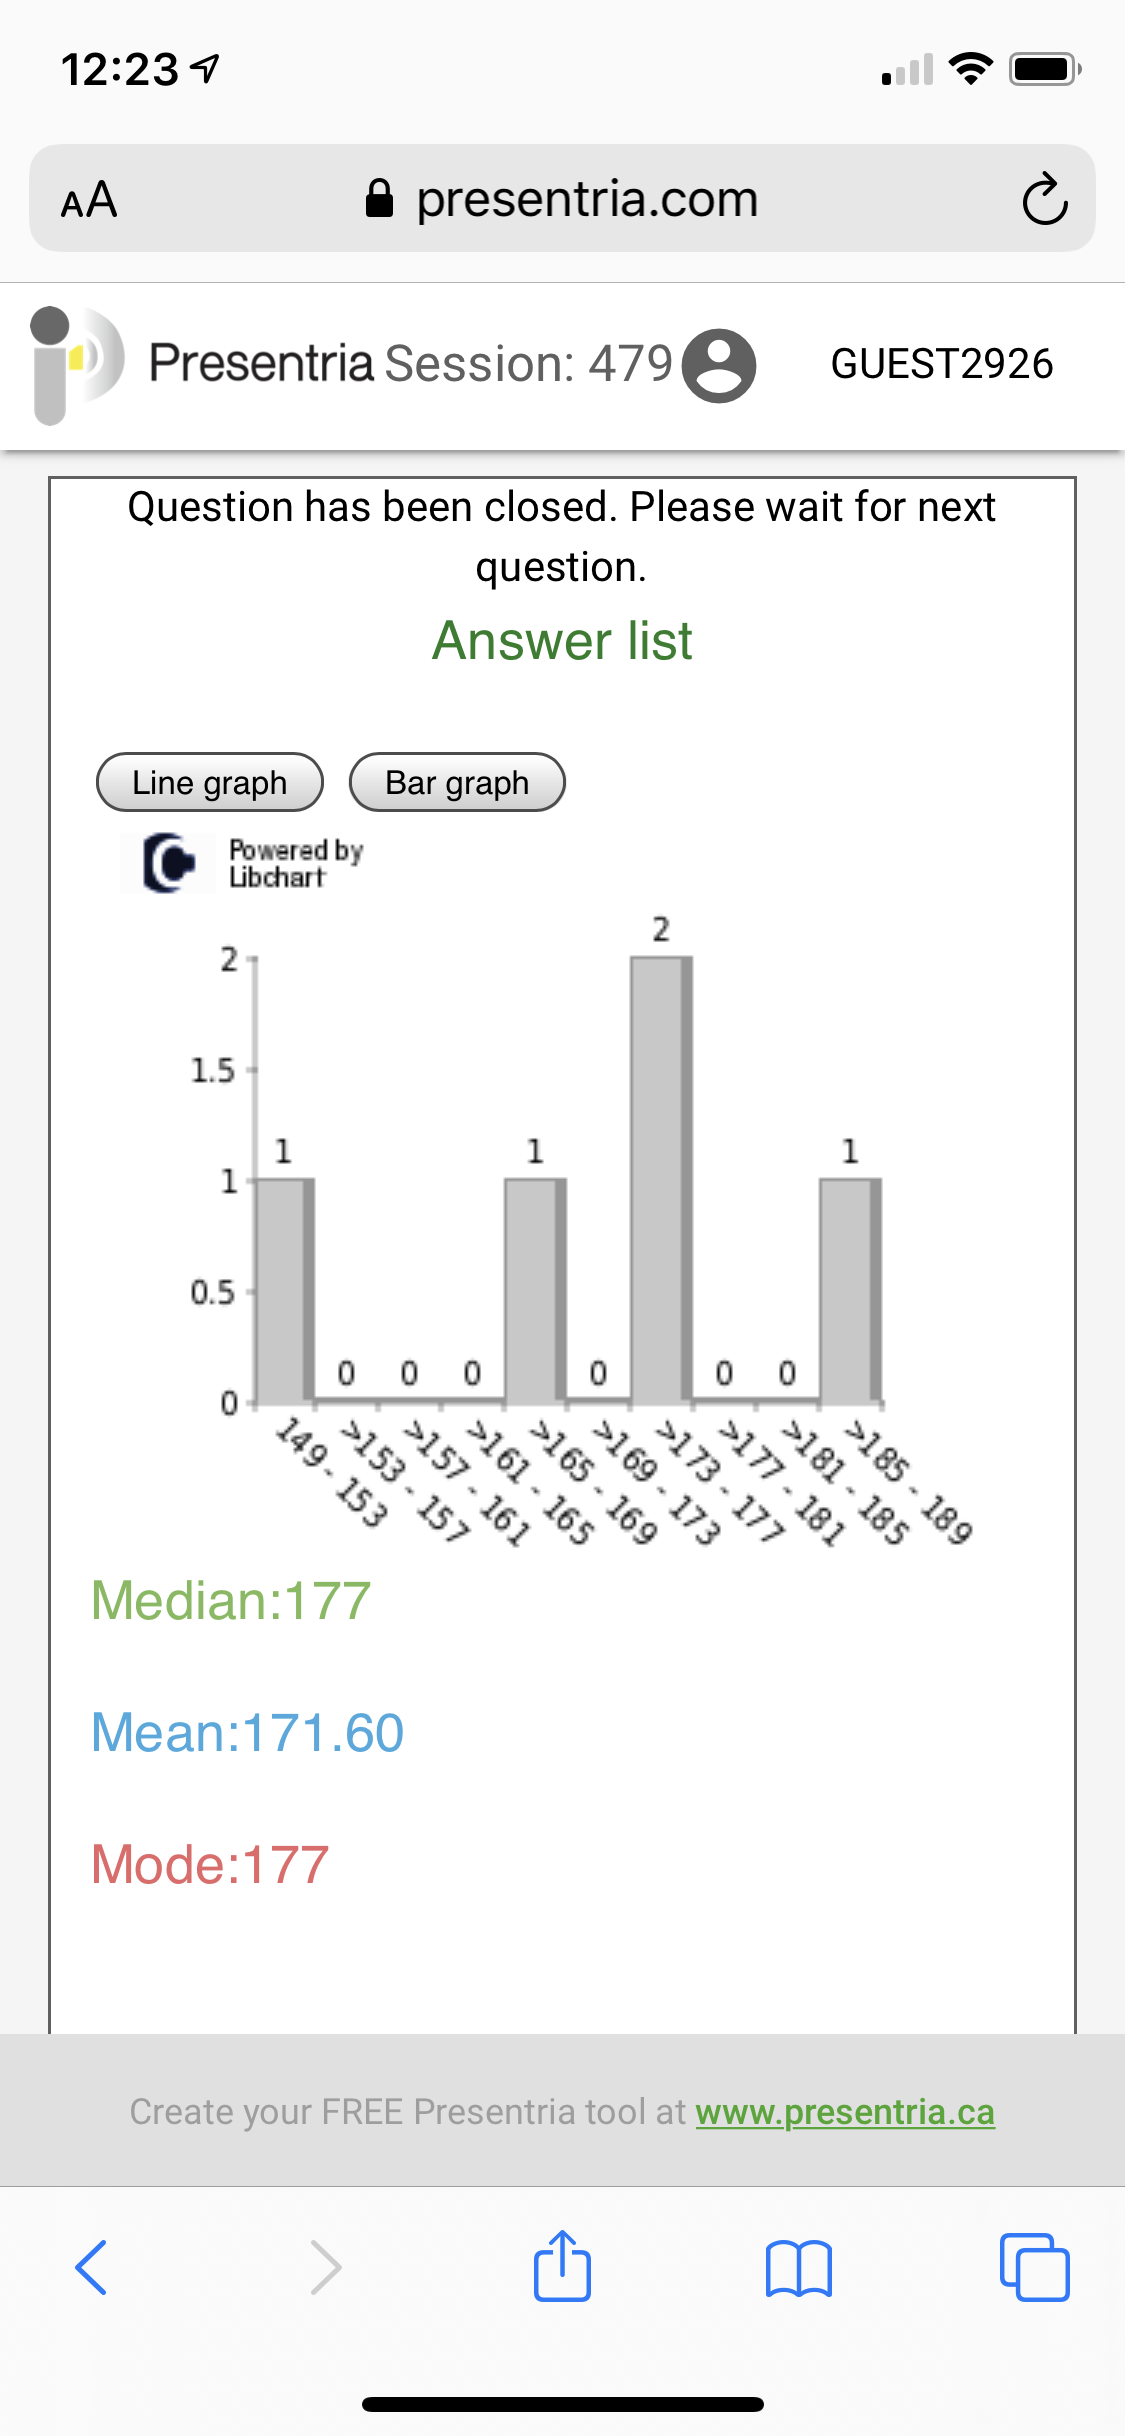
- You can show results using a bar or line graph, with basic statistics (Median, Mean and Mode), powered by LibChart.
- Results from the class are displayed on participants' devices and also on the projector screen.
- You can preview the question to understand how it may look like on a typical smartphone.
- You can enhance the question by changing font color/size, and adding hyperlink, images, YouTube Video, tables, divider-line, symbols, and equations to the question (via Question Bank only, not on Basic).
- You can set a timer for a question. Your options are 10 seconds, 30 seconds, 1 minute, 2, minutes, 3 minutes, 5 minutes, 10 minutes, 15 minutes, 20 minutes, 25 minutes, and 30 minutes. There will be animated reminder for the count down during the last 10 seconds.
 See what a Presentria quiz looks like:
- Log-in at http://www.presentria.com (no registration required)
- Use session number M98
 Learn more about...
Homework
LaTeX / Math Equation
Multi-item
Quick Log-in
Question Bank
Reports / Analytics
YouTube Video
Word Cloud
The result is summarized and displayed on the projector screen.
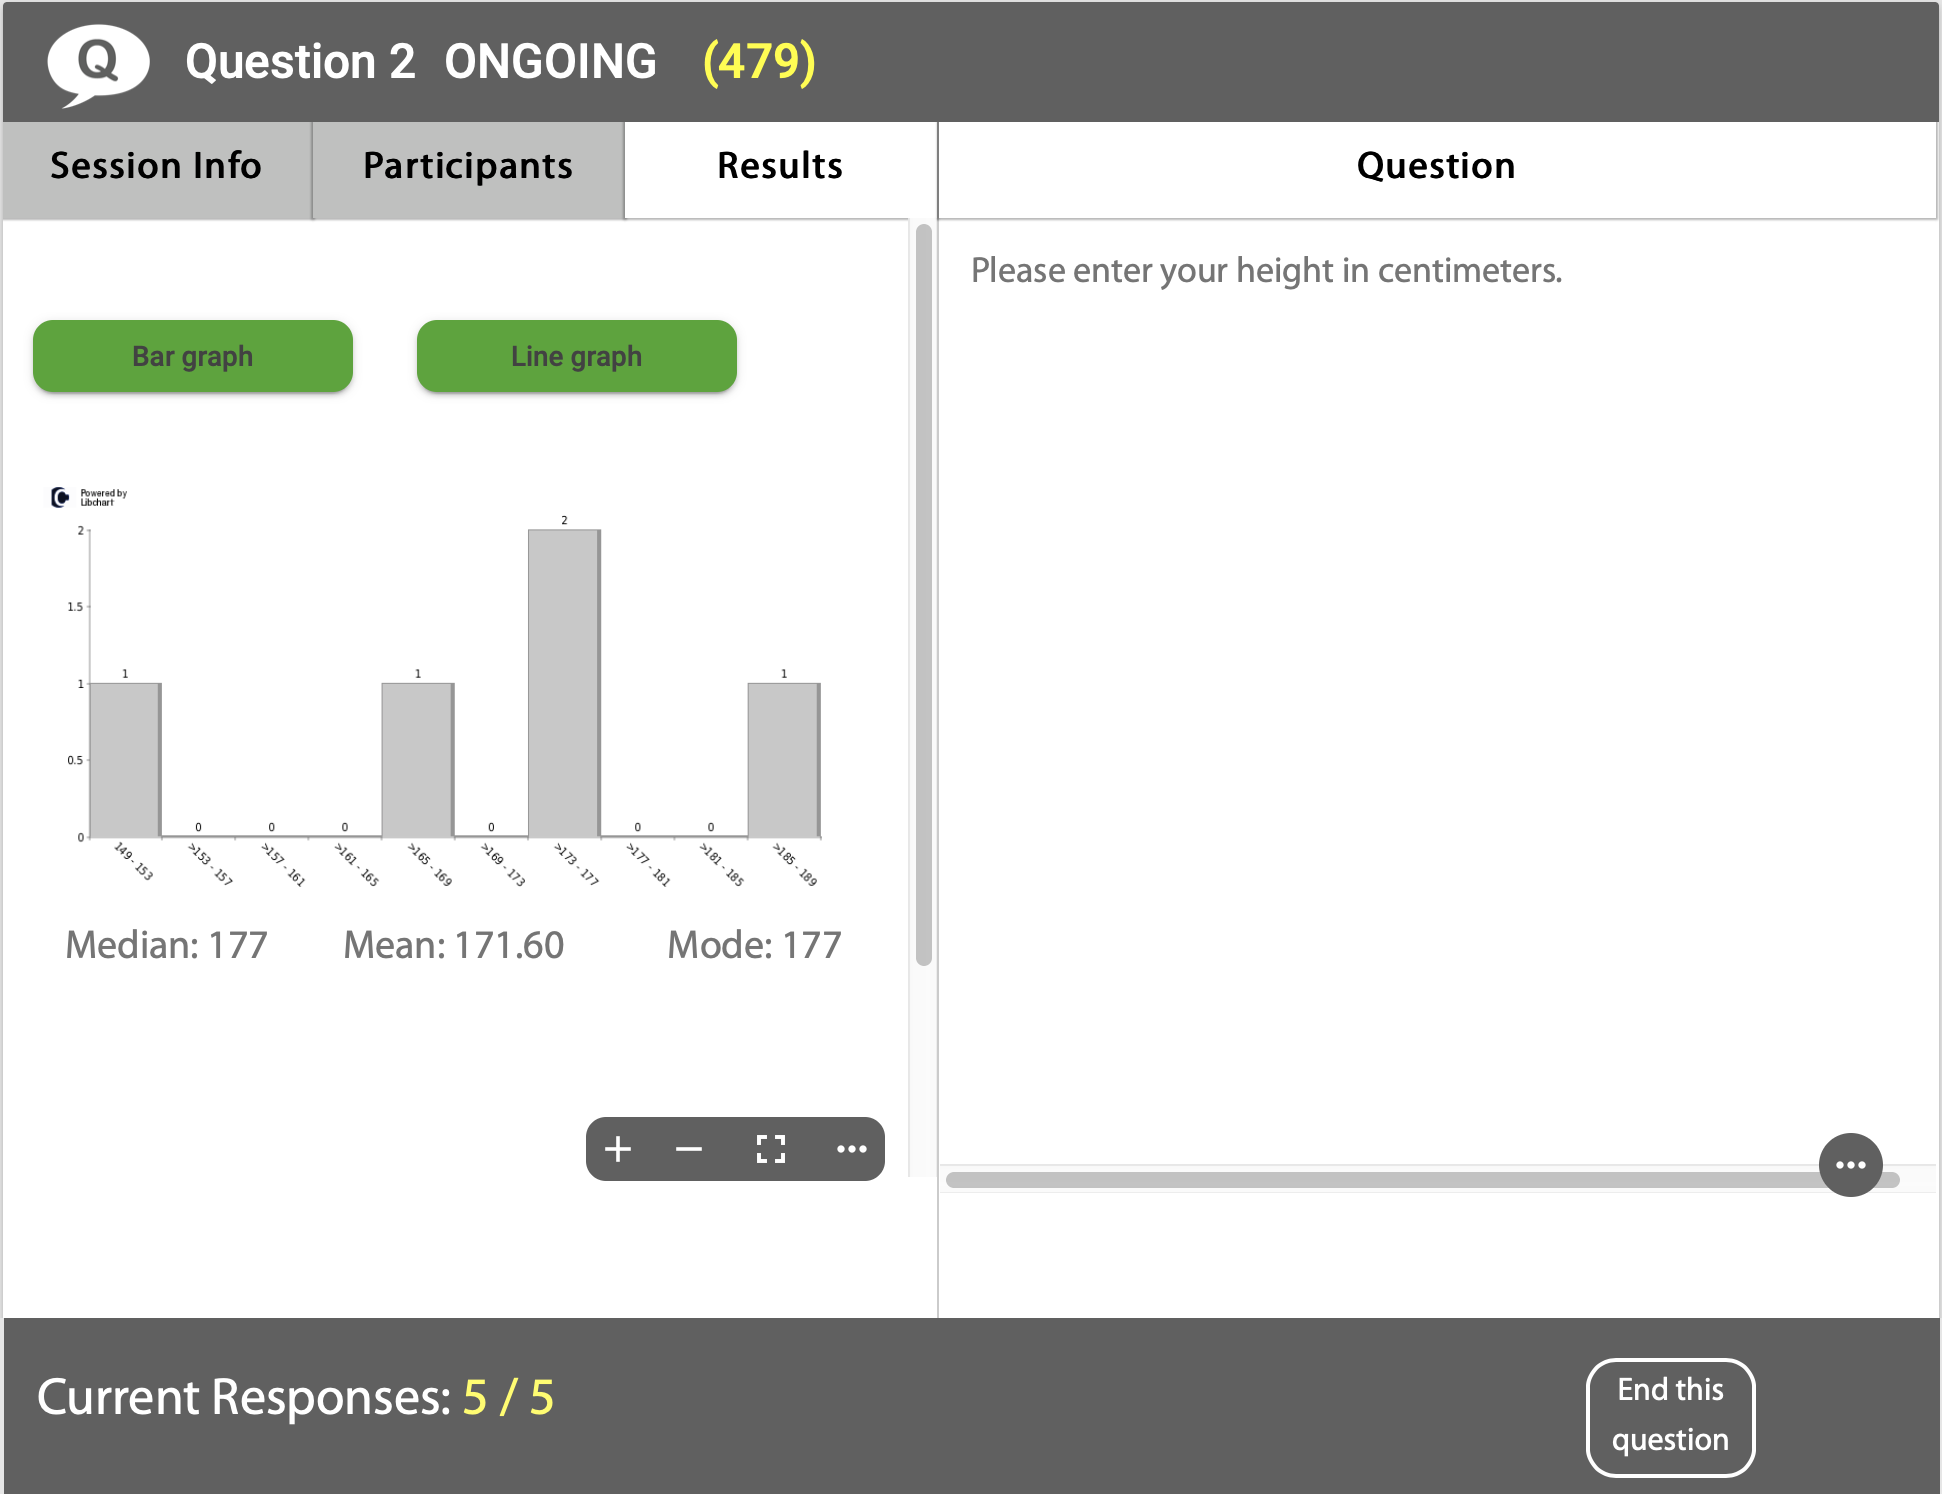
Data can be displayed in line or bar graphs.
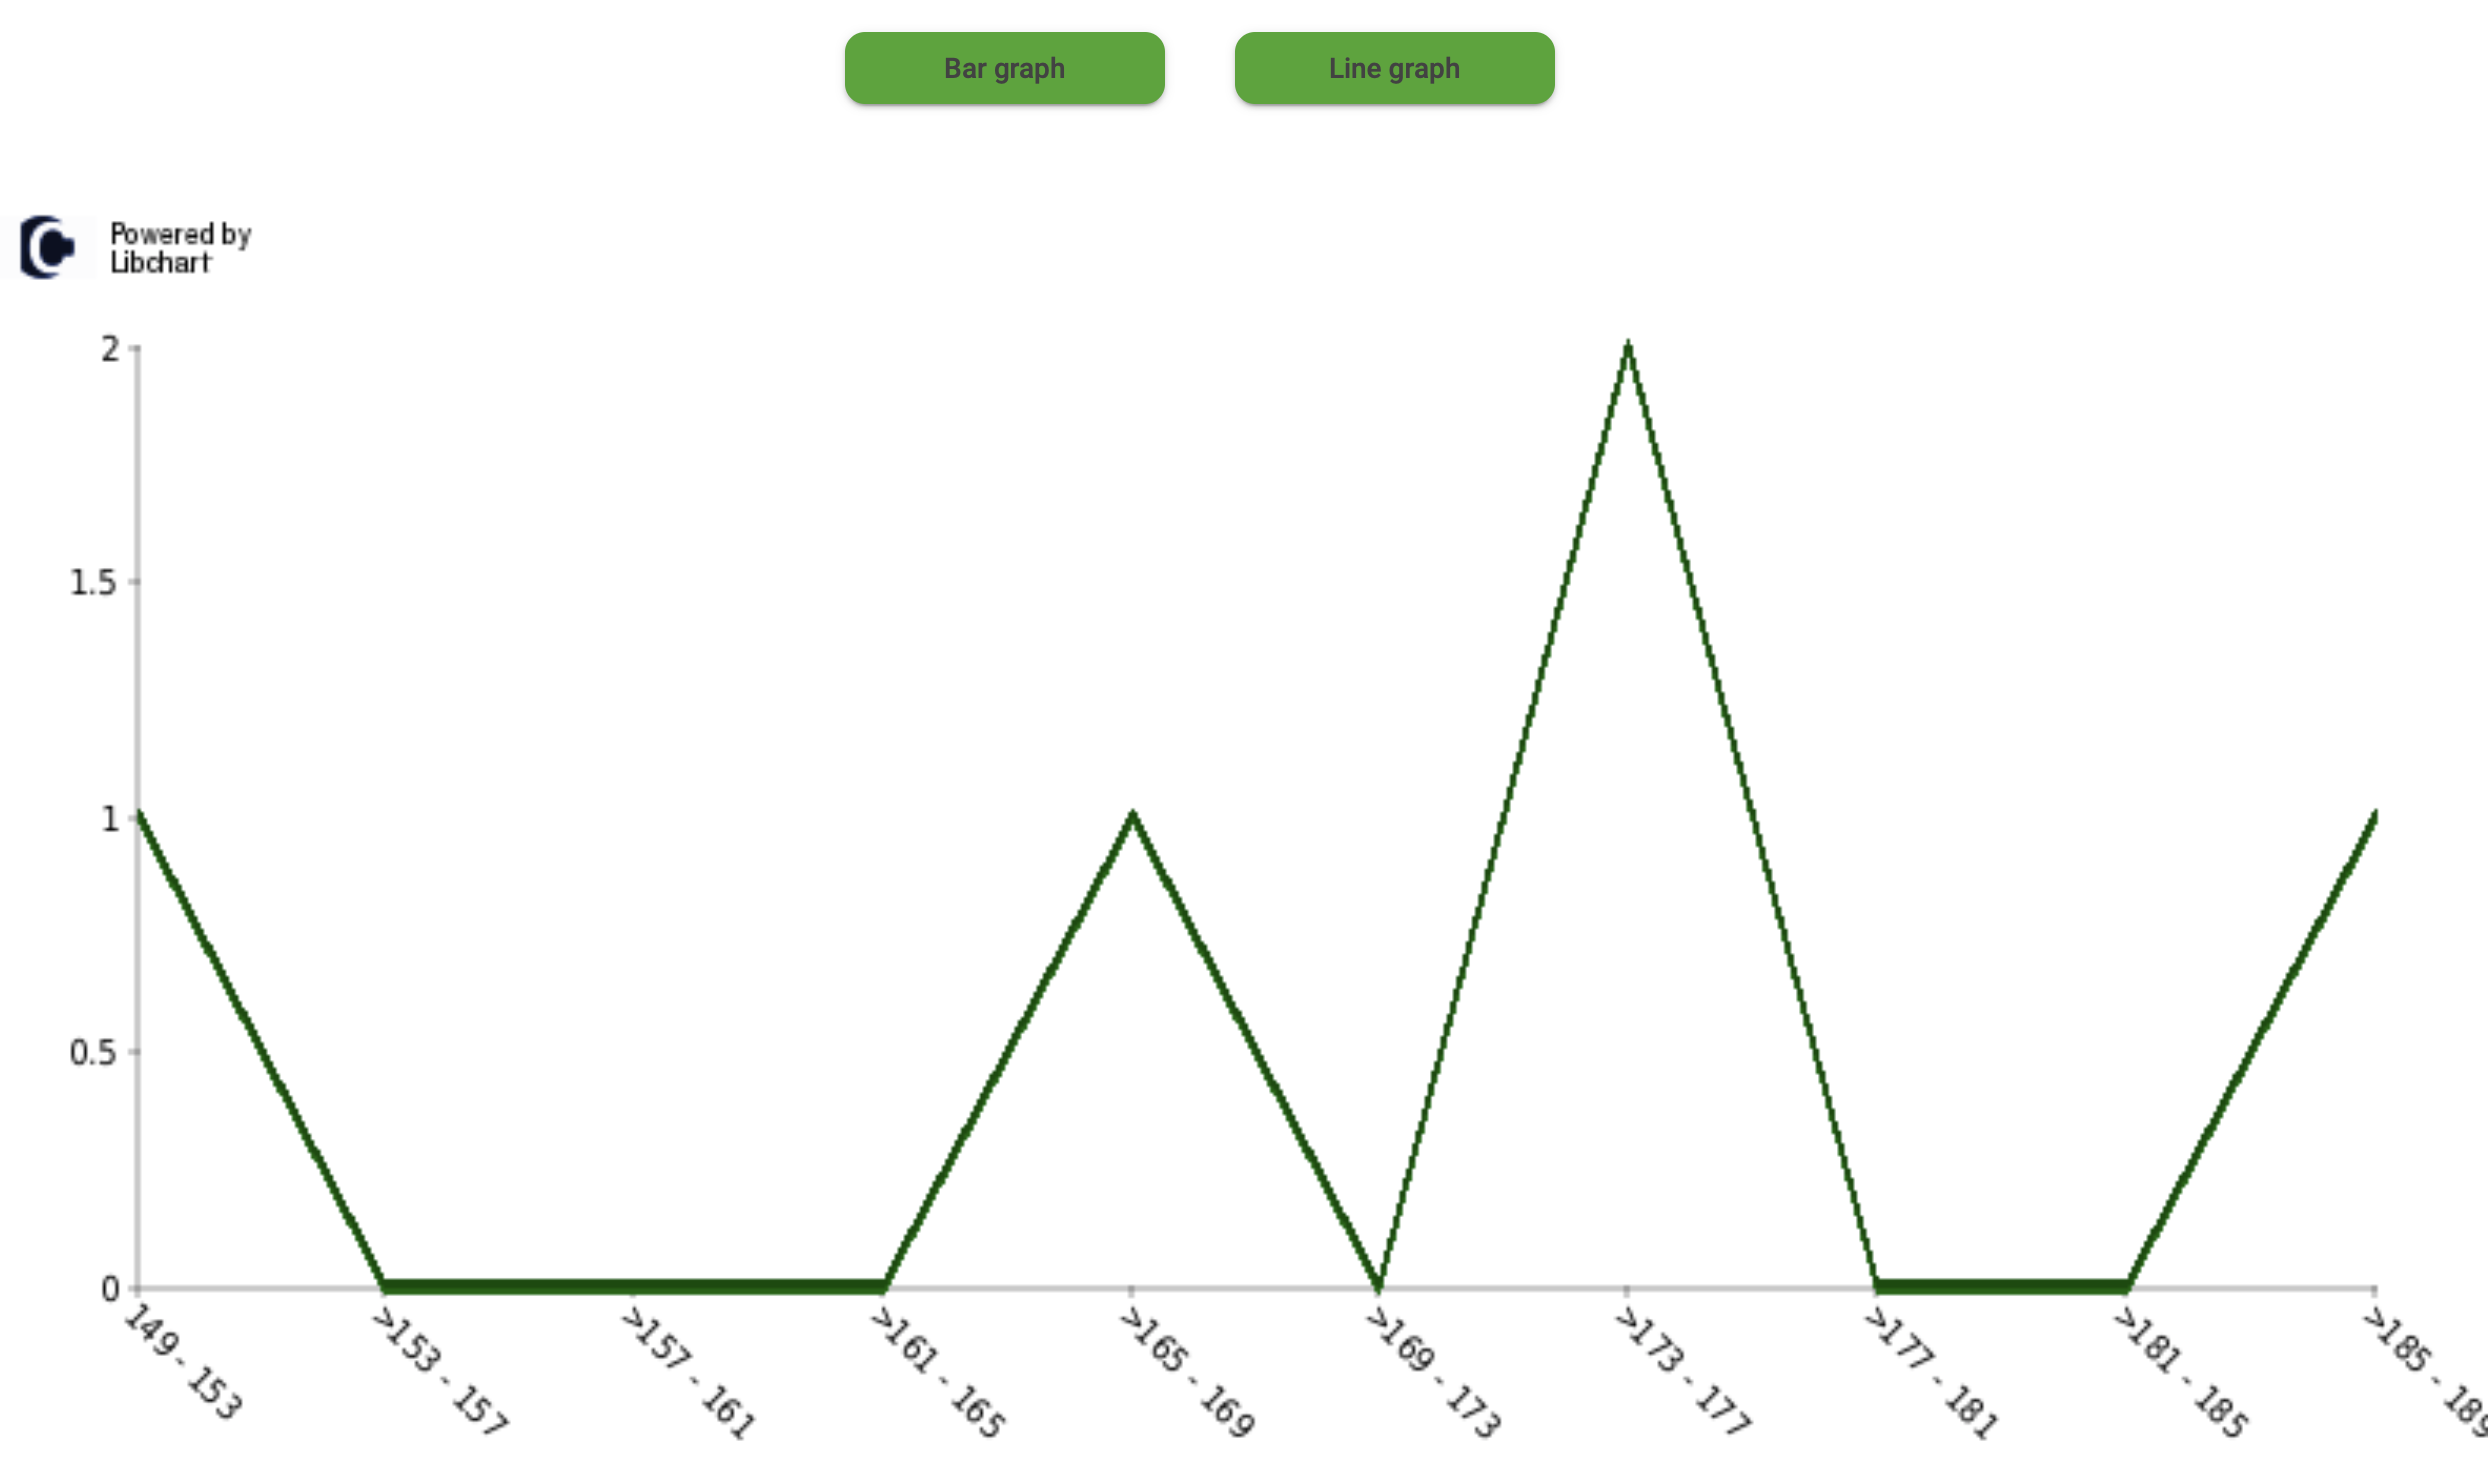
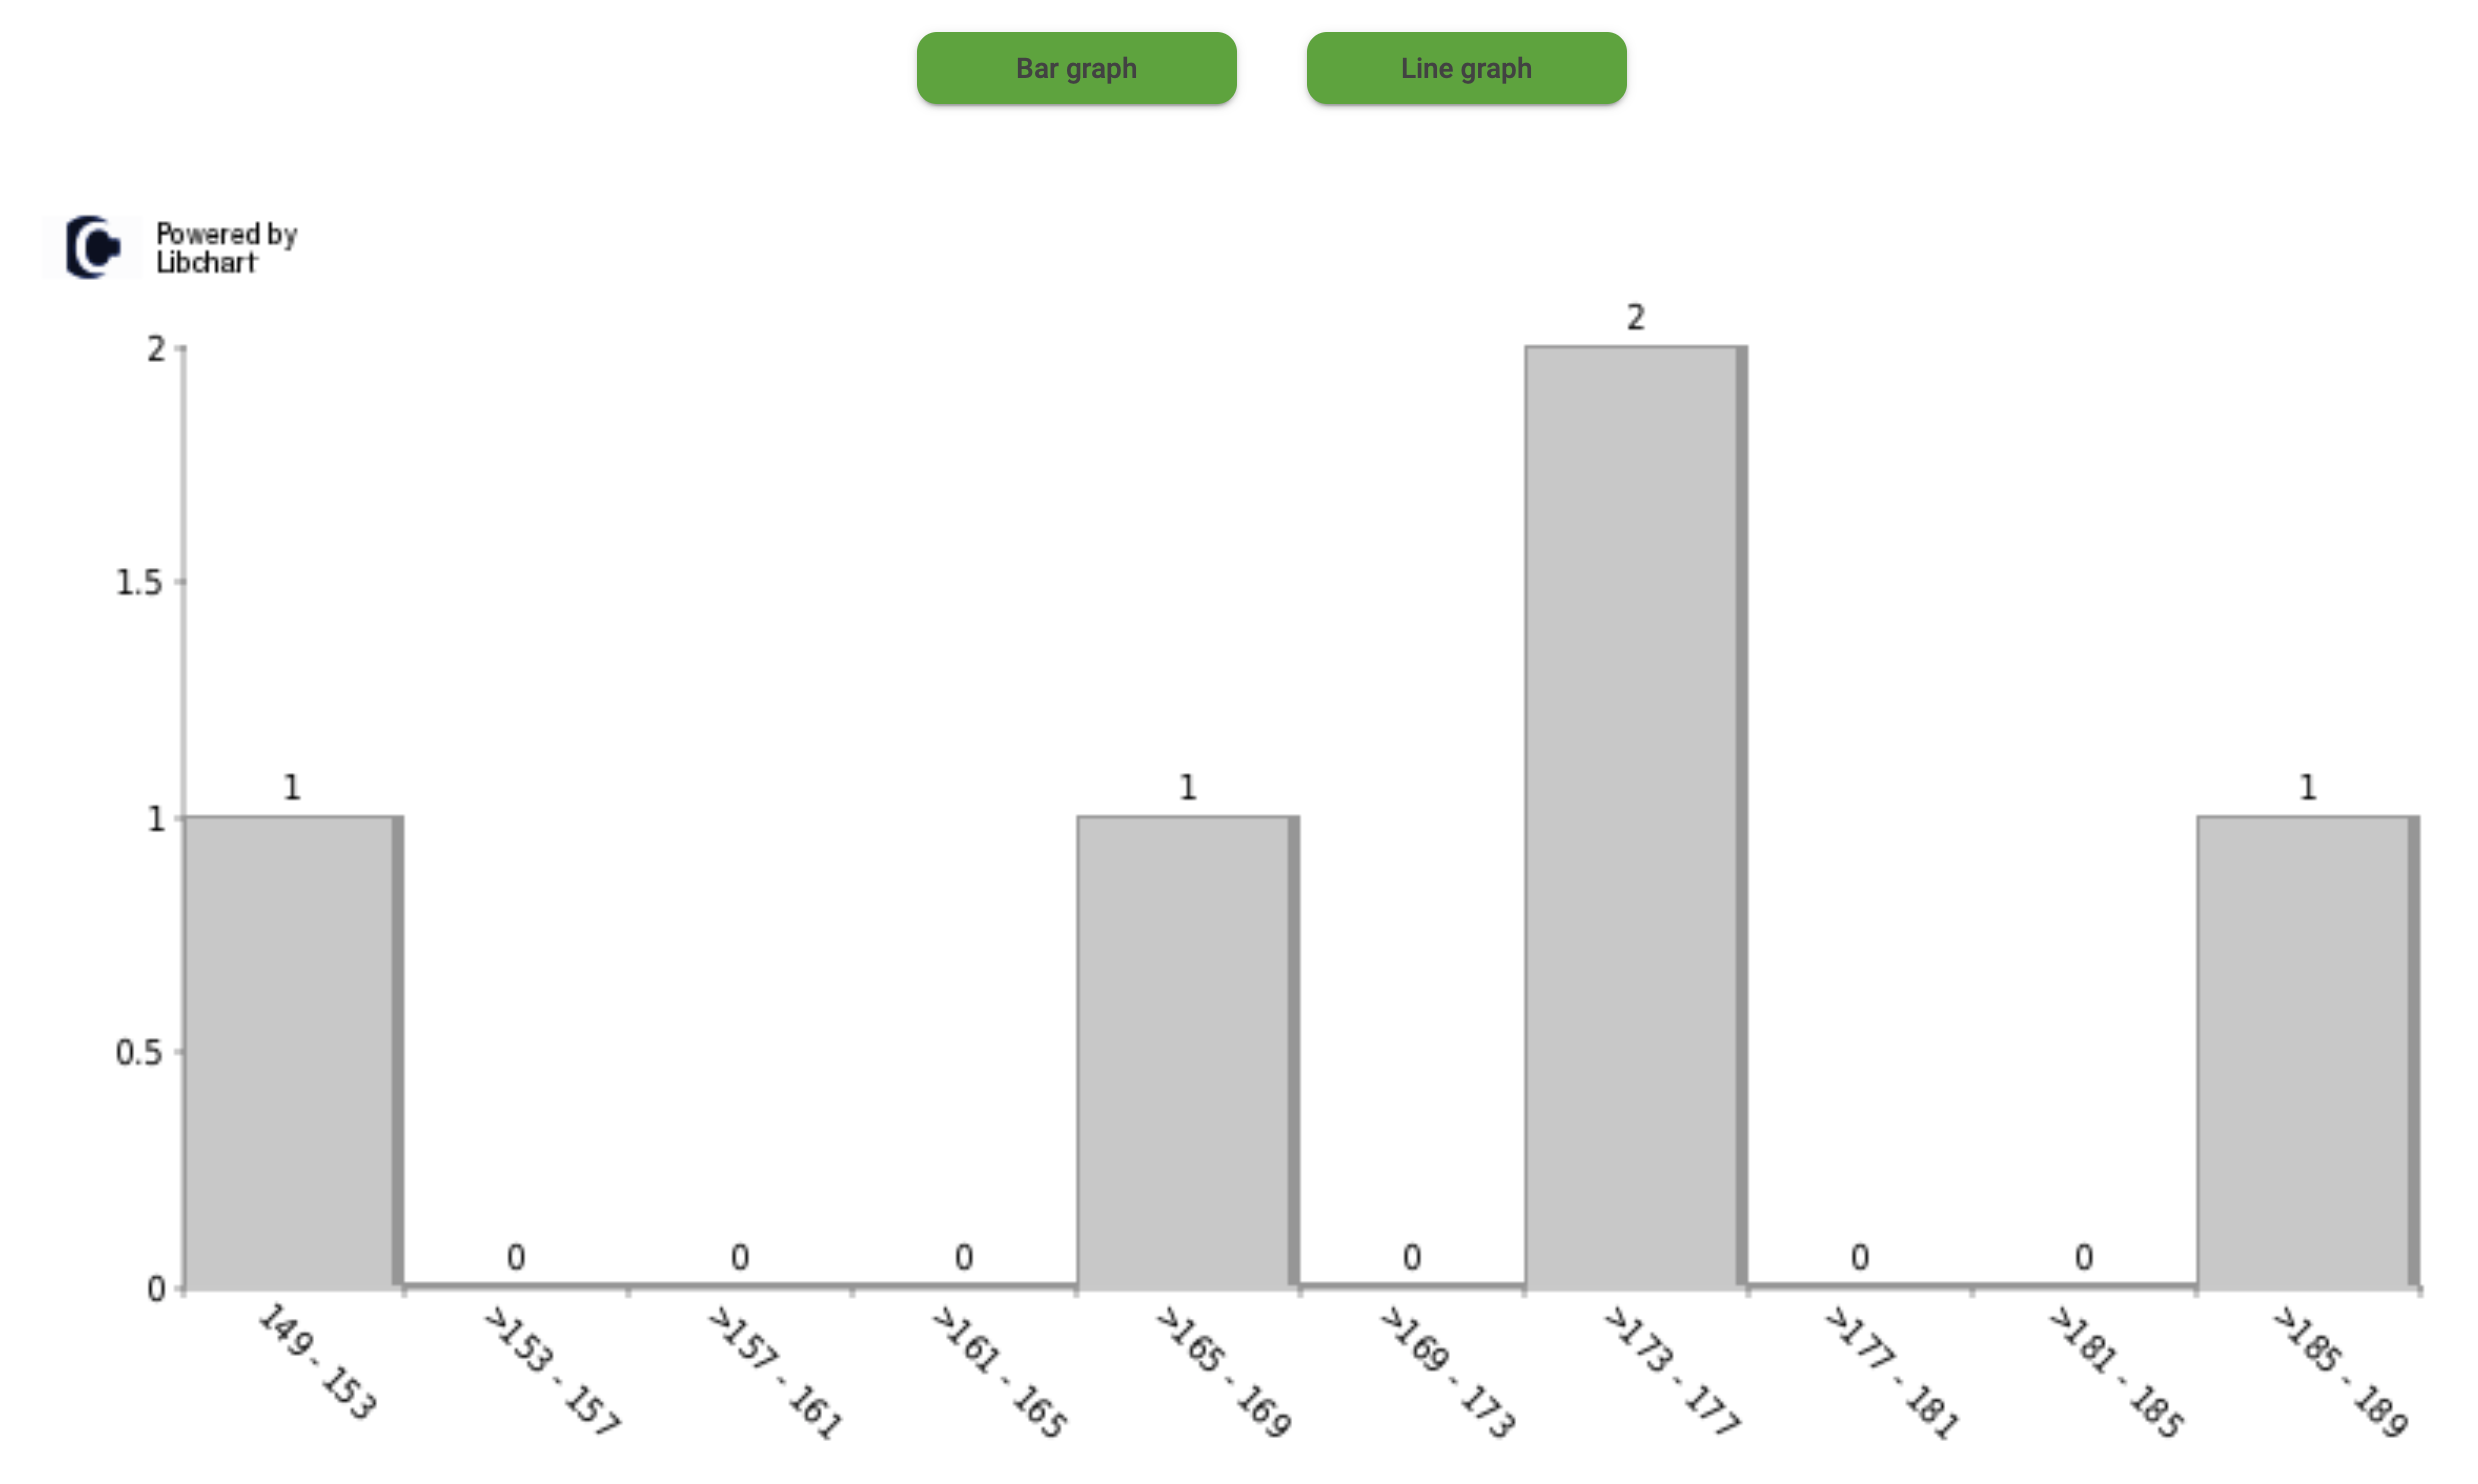
Results will be summarized and displayed on students' mobile device, once the question is ended.
